Thermally activated load shedding from
thermally thinned elastic crust:
a mechanism for density stratification of the crust and a possible contributing factor in core complex formation
J. Pearse (Ph.D. student) and R.C. Bailey
A load (e.g. a mafic igneous pile) sits embedded in the elastic upper crust and supported by it. The crust is heated, for example by the impinging of a plume at the base of the lithosphere. The lower crust becomes very ductile; the elastic upper crust thins, reducing its ability to support the load. The following results were presented at the American Geophysical Union and the Geological Association of Canada meetings in May, 2004.
What happens?
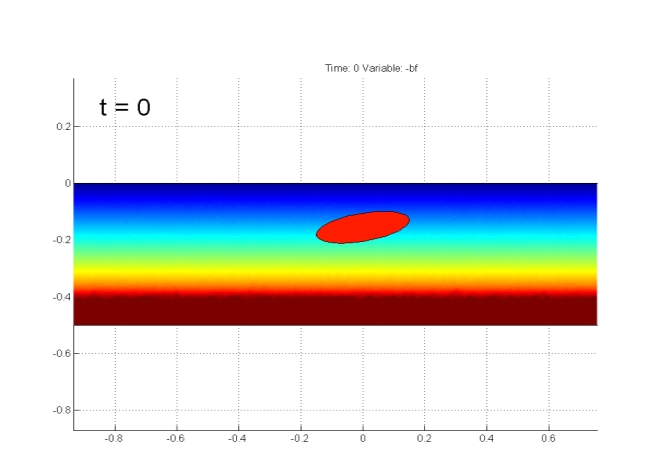
In this scenario, we heat the continental crust with an embedded dense load (shown above in red). The load is comparable with, for example, the embedded Keeweenawan volcanics which produce the Mid-continent gravity high which runs through the Michigan Basin; it has a density of 3.0 g/cc, a horizontal extent of about 30 km, and a maximum thickness of about 10 km. The initial density distribution is shown here. In this particular scenario, the enire modeled domain is very cold; at 2 Ma, the temperature at the base of the model (at 50 km) is suddenly lifted to a much high value. As a consequence, the Moho temperature (at 40 km) rises rapidly from 200 to about 1200 Celsius.
The model is 400 km across and 50 km deep; distance units in the plots are 100 km. The crustal density rises smoothly from 2.5 to 3.0 as the depth increases from 0 to 40 km, and then sharply rises to about 3.3 g/cc; this density change is the Moho. Erosion and/or sedimentation are assumed to keep the surface topography level (the software permits varying the erosion rate, but that is not done in this run). Only the central part (160 km wide) of the 400 km wide modelled region is shown in the movies and figures below. The time in Ma is shown in the upper left of the movie panels.
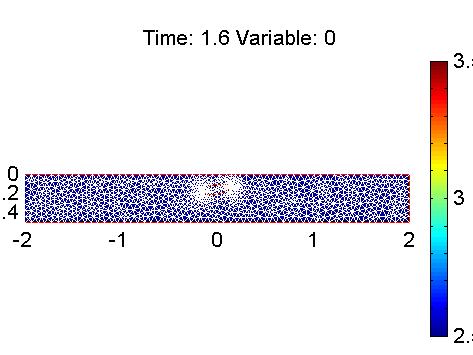
The initial mesh here is relatively coarse, with of order 10^3 finite element cells in the model. Regular remeshing to deal with cells distorted by the material motion makes the precise number of cells fluctuate from one timestep to the next. The coarseness of the mesh leads to some visible granularity in the computed results, but permits the code to run over 40 Ma of geologic time in about 90 minutes on our laptop.
Viscosity
evolution:
The viscosity of the crust is thermally activated, ranging from just over 10^25 Pa-S in cold crust, down to between 10^18 Pa-S and 10^19 Pa-S in the hottest crust. The mantle and the load are given higher activation energies for creep, so they are stiffer at the same temperature than the normal crustal material. A movie shows the evolution of the viscosity with time after the initiation of basal heating. The colours map the log of the viscosity: purple is high viscosity, orange is low. Note the development of a ductile lower crustal channel when the heating reached the more felsic rheology of the crust. When the elastic crust is thinned sufficiently, the mafic load tears away from it. The transient localized low effective viscosities visible in the uppermost crust above the load represent transient failure due to the compressional bending stresses here.
Stress
evolution:
The stresses are made clearer in a movie showing the horizontal deviatoric stress. The colour ranges from 50 Mpa of tension (blue) to 50 Mpa of compression (red). The fiber bending stresses associated with the elastic flexure of the upper crust are very clear in the early times prior to shedding of the mafic body. At late times, the mafic load hits the moho fast enough to induce a partially elastic response (see the “Physics evolution” movie below).
Flow
evolution:
The speed of flow is shown in a movie in which blue represents zero and red about 20 Km/Ma. The direction of flow is indicated by arrows and streamlines. The falling mafic load first (asymmetrically) pumps mid-crustal material outwards, and then after passing through most of the ductile channel, sucks it back again. At the end, the lighter crustal material entrained beneath the dropping mafic unit streams out and up around it in a “plume”, driven by buoyancy forces. Since the mafic body is now thermally softened, it folds in half. At the upper end of the “intracrustal plume”, the flow is retarded by loss of relative buoyancy relative to surrounding crust, and by the more viscous upper crustal material, and in response spreads laterally in a “mushroom cloud”.
Basin
History:
This scenario has complete erosion of any positive surface topography, and complete filling by sedimentation (at 2.5 g/cc) of any negative surface topography. Other scenarios are possible, but not developed here. In this movie, arbitrary colors are painted on the material in stripes, to track vertical uplift and subsidence. The total duration of the run is 40 Ma. Most frames are spaced 0.2 Ma apart.
Initially, the elastic upper crust flexes under the load, because it has been thinned thermally and will no longer support the load at this height. A sedimentary basin develops. The mafic body sags into the hot ductile lower crust; the now very soft enclosing material softens to the point where the mafic body tears away, first on the left and then on the right. The basin at the surface now inverts to a dome as the elastic crust rebounds. Additional uplift is provided by the late-stage diapirism (the “mushroom cloud”) around the mafic unit at depth.
The subsidence/uplift history of a point at the surface just above the initial centre of the mafic body shows an initial 3 km of subsidence followed by an uplift of about 6km.
Physics
Evolution:
The rheology used here is Maxwell viscoelastic (with plastic yield at stresses exceeding the Mohr-Coulomb failure stress). The relation of deviatoric stress s to deviatoric strain e is given by
Ds /Dt + s/t = 2 m De/Dt
The bulk and shear moduli (K and m) are 35 and 20 GPa respectively, independent of temperature. The viscosity is thermally activated, with the activation energy dependent also on lithology: the specific values are illustrated in the viscosity evolution movie above.
In our thinking about crustal behaviour, we often simplify our mental models to that of an “elastic” upper crust overlying a “viscous” lower crust. This view is surprisingly accurate, as the following movie shows. What is plotted is a “behaviour index” B, the fraction of the left hand side of the Maxwell constitutive relation above that is provided by the viscous term s/t. That is,
B = (s/t)/(Ds /Dt + s/t )
A zero value for B (blue) indicates purely elastic behaviour; a value of 1 indicates purely viscous behaviour. The movie shows the evolution of B with time in this scenario. Again, note that the transient or fluctuating viscous behaviour very near the surface reflects brittle failure, represented in the physics here by a low effective viscosity,