EXPLORING PN JUNCTIONS (2 hours) Exp. # 34
(Alward/Harlow web File: "pnjunct.doc" 3-10-04)
Name: _____________________ Partners: _______________________Section No.
_______
Equipment:
|
CADET |
1 red light-emitting diode (LED) |
|
2 multimeters |
1 solar cell |
|
2 black meter cables + alligator clips |
6 10 cm colored extension wires |
|
2 red meter cables + alligator clips |
3 30 cm colored extension wires |
|
4 silicon diodes |
1 330 Ω resistor |
|
graph paper |
Computer with PASCO Voltage sensor |
|
1 10 KΩ resistor |
1 ruler |
Extra equipment for class: 0.5 A fuses (5 × 20mm), wire clippers, potentiometers, cans of circuit chiller
I. Purpose and Theory
We wish to investigate the behavior of PN junctions, or diodes. We will measure a characteristic current-voltage curve, the turn-on voltage and half and full-wave rectification. We will also examine light emiting diodes (LEDs) and solar cells.
An n-type semiconductor is an insulator doped with a material which allows electrons to flow easily. A p-type semiconductor is an insulator doped with a material which allows electron ``holes'' flow easily. When a junction is formed between a p-type and n-type semiconductors, this is called a PN junction, or ``junction diode'' or simply, ``diode''. When a voltage is applied to push current from the p-side to the n-side, this is called ``Forward Bias'' with low resistance and high current flow. A forward bias doesn't ``turn on'' at low voltage. No noticeable current flow will flow through the diode until the voltage is above a minimum, called the ``turn-on'' voltage. When voltage is applied to push current from the n-side to the p-side, this is called ``Reverse Bias''. Almost no current will flow through a reversed biased diode.
II. Comparing a Resistor and a Diode
In this section we will first plot the current-voltage (I-V) curve - called the ``characteristic curve'' - for a resistor, then later on the same graph we will plot the characteristic curve for the diode. We will use the CADET to provide a source of –3V (blue), +3V (yellow) and ground (black). We will connect these three to a potentiometer to allow us to select a continuous range of voltages between -3 and +3Volts.
Characteristic Curve for a Resistor
Use the multimeter set to measure volts to adjust the variable voltages on the CADET (yellow: +3 , and blue: -3).
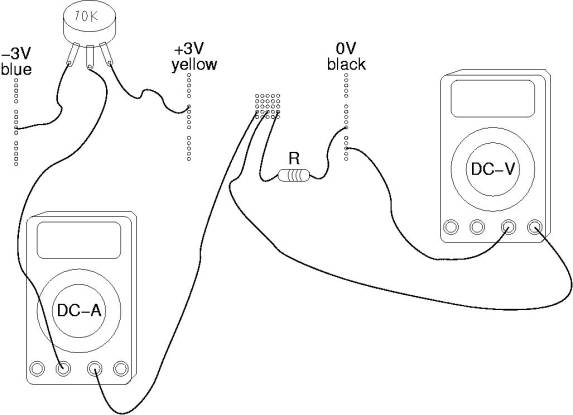
Connect two multimeters, a potentiometer and a 330 Ω resistor in the circuit shown below, first as a circuit diagram, then as a cartoon sketch. In this setup, you should be able to use the potentiometer to adjust the voltage passing through the resistor through the range –3 to +3 Volts. (Check this.)
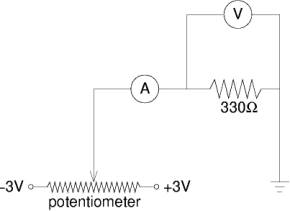
Use the dial on the potentiometer to vary the voltage from about –1.0V to +1.0V in approximate steps of 0.2V, for about 11 measurements. For each voltage, record the voltage and current in Table 1. Be sure to include the signs of the voltage and current.
Table 1: The 330 Ω Resistor
|
Voltage (V) |
Current (mA) |
|
|
|
|
|
|
|
|
|
|
|
|
|
|
|
|
|
|
|
|
|
|
|
|
|
|
|
|
|
|
|
|
|
|
|
|
Plot your measured values of current, I, versus voltage, V, for the resistor. Use graph paper provided. The vertical axis should be current in milli-Amperes ranging from –5 to +5, and the horizontal axis should be voltage in Volts, ranging from –1.0 to +1.0. Don't forget to attach this graph to your lab write-up at the end.
Use a ruler to draw the best straight line through the data points. Since zero current should flow for zero voltage, the line must pass through the origin. Pick two widely separated points on your best-fit line and measure the slope in amperes/volt. What do you expect the slope to be, given that the resistor has a reported resistance of 330 Ω? Show your work below.
Measured Slope: _________________
Predicted Slope: ___________________
Percentage Difference: _________________
The Temperature Dependence of Resistors
Reset the voltage to about 1.0V and note the current. This is the “warm-current”. Grab a can of circuit chiller. Direct a one-second (not longer than this) burst of chiller at the resistor. Watch the current while you do this. Does a short blast of chiller change the current through the resistor noticeably? Briefly describe your observations below.
Characteristic Curve for a PN Junction Diode
Replace the resistor with a silicon diode. One end of the diode should be marked with a painted band which shows the negative, or n-side of the junction. Connect the p-side closer to the potentiometer and the n-side to ground, as shown in the circuit diagram below.
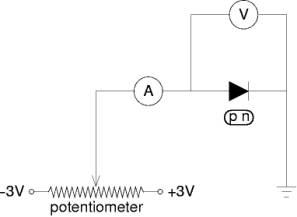
Again, use the potentiometer to vary the voltage between –1.0V and +1.0V, recording current for about 12 different voltages. Record your measurements in Table 2.
Table 2: The Diode
|
Voltage (V) |
Current (mA) |
|
|
|
|
|
|
|
|
|
|
|
|
|
|
|
|
|
|
|
|
|
|
|
|
|
|
|
|
|
|
|
|
|
|
|
|
On the same graph used to plot the resistor's curve, plot I versus V for the diode. Try to draw a smooth curve through your data points showing the trend.
The “turn-on” voltage may be defined as the voltage at which the resistance of the diode drops below 330 Ω. Look at your data and the two lines on your graph, and find the voltage above which the diode current becomes greater than the resistor current. Record this value below:
Turn-On Voltage: _________________________
The Temperature Dependence of Diodes
Reset the voltage to about the turn-on voltage and note the current. This is the “warm-current”. Grab a can of circuit chiller. Direct a one-second (not longer than this) burst of chiller at the diode. Watch the current while you do this. Does a short blast of chiller change the current through the diode noticeably? Briefly describe your observations below.
Remove all wires and other elements you inserted in the CADET breadboard. Put
the meters to one side.
III. Half-Wave Rectification
To “rectify” means “to set right, or adjust”, but when applied to alternating current it means “to make unidirectional”. A rectifier is a device which removes the negative half-cycles from an alternating current (AC) signal while preserving the positive half-cycles. A diode will rectify an AC signal, providing the input amplitude is larger than the turn-on voltage (this is what allowed your AM radio to work in a previous lab.) In this section we will rectify an AC signal with a silicon diode.
1. Turn on the black PASCO box, then turn on the computer.
2. Double-click on the Science Workshop icon to begin the PASCO software. Go to the File pull-down menu and open the file “diode.sws”. If it is not in the list of files, get a copy from the instructor or TA from the Physics Department web site.
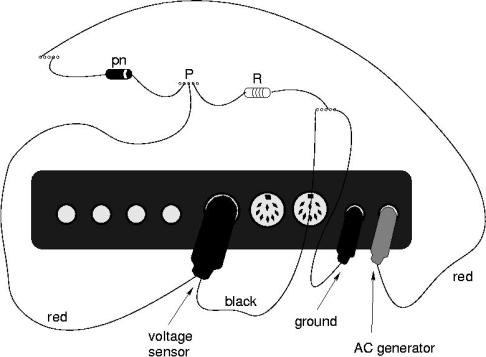
3. The circuit you wish to create is illustrated in the circuit diagram below.
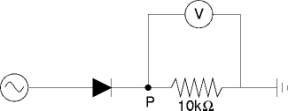
For the AC generator on the left, you will use the OUTPUT on the PASCO box. For the ground on the right you will use the ground plug on the OUTPUT on the PASCO box. You will use the voltage sensor on the PASCO interface to measure voltage across the 10kΩ resistor, which will give voltage at point P. Note that by Ohm's law, the current through the circuit is:
![]()
where V is the variable voltage supplied by the AC generator, VP is the voltage at point P, and Rd is the resistance of the diode.
Solving for VP:
![]()
If the resistance of the diode goes to zero, VP will be close to V, the input voltage from the AC-generator. As the resistance of the diode increases, |VP| will drop toward zero.
Construct the circuit above, which is also shown in cartoon form on the next page. Note that we are only using the CADET as a breadboard in this step. Its function is to connect the diode and resistor without solder; we will not be using any functions on the CADET and it need not be turned on for this step. Use banana plugs to plug into the OUTPUT of the PASCO box and the Voltage sensor to plug into Channel A of the Analog Channels on the PASCO Box.
4. On the computer, click the “On” button of the signal generator. It should be set to a sine-wave AC waveform, with amplitude 3V and frequency 100 Hz. Then click the “Rec” button in the data window to begin recording. After a few moments, you may click the “Stop” button so as to not fill up the memory of the computer.
5. Examine the graph in the Scope window. The green line is the voltage of the AC signal. The red line is the voltage at point P, VP, which is related to the current through the diode. You may adjust the vertical scale to make the green and red curves fit in the window by clicking on the zig-zag buttons to the right the “V/div” displays to the right of the main scope window. There are separate scales for the red and green lines; make sure they are set to the same V/div. You may also adjust the horizontal scale, but this changes the number of samples per second. The computer should only set to record in 2500 samples per second or less.
6. The green line is a sine-wave. Is the red line also a sine-wave? Does current through the diode go both positive and negative?
7. Note the splitting between the maxima of the input voltage and voltage after the diode. They differ because the diode has finite resistance at this input voltage. The input voltage is 3V. What is the maximum of the red line?
Maximum Voltage at P:
8. In the Signal Generator window, adjust the amplitude down to 1.0V, leaving the frequency at 100 Hz. Begin recording again, and adjust the V/div so that the curves fill most of the scope window. Note the splitting. Grab a can of circuit chiller. While the computer is recording, direct a one-second (not longer than this) burst of chiller at the diode. Watch the red line while you do this. Does a short blast of chiller change the splitting between the green and red line maxima? Describe below what happens to the red line when the diode is cooled.
IV. Full-Wave Rectification
Rectification of an AC signal is useful when one wishes to operate a DC appliance with an AC source. In the last section you explored half-wave rectification in which only the positive half-cycles of the AC input were passed through the diode. Thus, the resulting DC signal was “on” only half the time. In the procedure which follows, we will create a rectified signal which is on all the time, not just half of the time.
One circuit which can do this is called a ``bridge rectifier'', shown on the next page. When the AC generator is positive, current must go from the AC generator to the ground, while only passing one-way through the diodes. Use your finger to trace the shortest line going from the AC generator to the ground and note which way the current goes through the resistor. Next, imagine the AC generator is negative, so current must go from the ground to the AC generator. Trace with your finger this way and again note which way the current goes through the resistor. Remeber, current may only flow one way through a diode!
1. The circuit you wish to create is illustrated in the circuit diagram below and cartoon below.
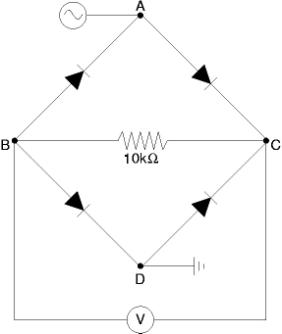
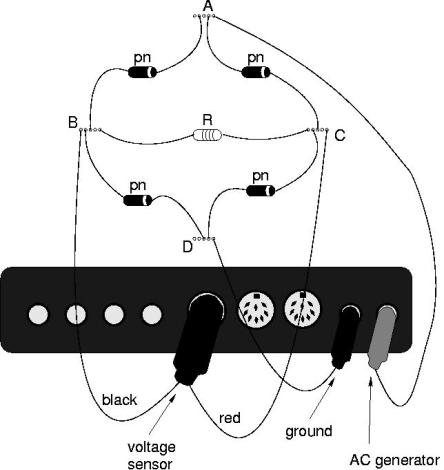
For the AC generator, you will use the OUTPUT on the PASCO box. For the ground you will use the ground plug on the OUTPUT on the PASCO box. You will use the voltage sensor on the PASCO interface to measure voltage across the 10kΩ resistor, which will give voltage difference between points B and C. Construct the circuit above.
2. In the Signal Generator window, adjust the amplitude up to 3.0V, leaving the frequency at 100 Hz. Begin recording again, and adjust the V/div so that the curves fill most of the scope window. Sketch the two curves in the graph on the next page, indicating which is the signal (green line) and which is the output (red line). Please indicate your choice of scale on both axes.
Exit Science Workshop, but when prompted please click “Don't Save”. This will leave the default diode.sws file intact for the next group. Turn off the computer and PASCO box, unless otherwise instructed by your instructor or TA.
V. Light-Emitting Diodes
When an electron falls into a hole, it loses energy, and this energy is emited as a photon. A photon is a packet of electromagnetic waves. The type of material from which the diode is made determines the wavelength of the electromagnetic waves emited. An LED is a diode whose photons are visible to the human eye. One of the most common LEDs is the one made with GaAs. This diode emits red light.
Between the 5V power supply on the CADET and the ground, place an LED and a 300Ω resistor in series. The resistor is necessary to prevent the LED from burning out due to overheating.
1. Does the LED light up when it is connected in both directions? Which leg (longer or shorter) must be closer to the positive power supply?
2. Use the multimeter in DC-V setting to measure the voltage across the diode while it is on. Report this as the “turn-on” voltage below.
Turn-On Voltage: _______________________
VI. Solar Cells
Just as electrons and holes can combine to generate light, so can light create an electron and a hole.
If the incident light is absorbed in the region near the interface of a PN-junction diode, the created electron-hole pair will immediately separate, each propelled in opposite directions by electrostatic repulsion. These charges collect in separate areas, much as they do at the terminals of a battery. Thus, the PN-junction acts like a kind of DC battery. If many of these are chained together, a considerable voltage may be generated. This is one kind of “Solar Power Generator”.
Attach the clips from the multimeter cables to the output leads of the solar cell and observe and record the voltage with the cell facing strong light. Repeat this with the cell facing away from direct light. Finally, measure the voltage with the cell completely covered. Record all voltages below:
Voltage in direct light: ___________________
Voltage in indirect light: ____________________
Voltage with no light: _____________________
When you are finished, please straighten all wires, resistors and diodes and place all components at the end of the table for inventory.