PHY405 Electronics, Lab 1
Adapted from Prof. David Bailey's website in 2022
Sign in
Please sign in every time you use the lab, including regular practice sessions and free-lab sessions.
Overview
An introduction to many basic course instruments and tools.
- Familiarization with operation and characteristics of electronic workstation equipment:
- Soldering
- Oscilloscope / Wave Generator, Multimeter, DC Power Supply
- Simple real circuit on breadboard
Background preparation before starting the lab
- Read through all these Lab instructions before Lecture 1.
- It will be sad if you run out of time to finish the exercises because you were doing things in the lab that should have been done before the lab.
- e.g. Look up the technical specifications for your instruments for your instruments before the lab.
- You might even be able to answer a question before coming into the lab.
- You will be building a real circuit that you previously simulated, so be sure you have access to the link to your circuit so you can build it and revise it if necessary.
- It will be sad if you run out of time to finish the exercises because you were doing things in the lab that should have been done before the lab.
- If the instructions are unclear or require doing some research, ask questions at the Lecture or look things up before the lab instead of after starting the lab.
- If any circuits are to be designed, do this before the lab.
- Attend Lecture.
- If you have never soldered, watch this Soldering Tutorial for Beginners by Heidi Baumgartner.
- If you have never used a solderless breadboard, watch this How to Use a Breadboard by Ben Finio of Science Buddies.
- Our breadboards are bigger and mostly lack the labels shown on the breadboards in the video.
- You are expected to make your own jumpers from hook-up wire.
- Read the notebook guidelines and report guidelines.
- Be sure to bring a phone/tablet/camera to take photos and videos.
- If neither member of your pair has a camera, let the TA or Instructor know.
For clarity and simplicity, anything that must go into your report for this lab is in a highlighted text box like this and labelled “R-1, R-2, …”. Answers to the specific lab questions must be clearly and obviously labelled in the report, e.g. with “R-1”, “R-2”, ….
Each response box (i.e.”R” box) has the same weight. Part marks may be given. The number of questions will vary from lab to lab, but each lab is worth the same fraction of your final course grade.
The report for this lab should not be more than about 4 pages, but shorter is fine (and even preferred).
Remember
- Both students in a pair are expected to take turns and share all aspects of the work.
- If something interesting happens, take note of it and - if time permits - investigate it.
- This is lab course, so don’t be discouraged if things break or don’t work first time. Debugging circuits/experiments/code/… is a fundamental physics skill that needs practice to learn.
- If you get stuck, talk to the TA or Instructor or move on to another task.
On arriving in Lab
- Go to your assigned station with your partner. If you do not have a partner, we will assign one.
- A locker will be assigned to you. Open the locker and take out equipment.
- Let Instructor know if locker is too high (or too low) for you.
Safety Reminders
- Wear safety glasses when soldering.
- The tips of soldering irons are burning hot – don’t touch!
- Wait a few seconds for components to cool after soldering before touching.
- Static discharges can destroy equipment and components. It is easy to generate kilovolt discharges if you wear synthetic clothing or sit on a plastic chair.
- Typical resistors used in this course have a maximum power rating of 1/4 W and will get very hot and “fry” (self-destruct) if this rating is significantly exceeded. e.g. Power dissipated is P=V2/R, so a 1/4 watt 100 ohm resistor may get very hot with as little as 5 V across it.
- Be careful touching components in your circuit.
- If your circuit smokes or smells, turn off its power!
- The ends of cut wires can be sharp.
- When cutting wires, don’t put your unprotected eye too close in case the cut piece flies out.
- It is normal for things to break sometimes, so don’t panic if it happens.
- Let the TA or Instructor know if an instrument isn’t working properly.
- Some LEDs can be painfully bright if their specified voltages exceeded, so don’t stare at them.
Exercises
Soldering
Although you will usually use solderless breadboards in this course, it is useful to be able to do basic soldering if needed. Today every student will make a 2-Wire-to-BNC Adapter probe, which is handy for measuring and applying voltages at different points on the solderless breadboard.
Since we have only 4 soldering stations, pairs will take turns. While waiting, work on the other lab exercises.
To create your probe, get a BNC coax bulkhead jack and 20cm or so of two different colours of standard lab wire. For consistency with standard conventions (e.g. our BNC-to-banana-plug cables), a good choice is red and black for the inner and outer wires, but it is up to you. Strip the ends of the wires, wrap/insert them into the two connectors on the jack, and solder them, as shown in the figure.
- The soldering iron temperature should be set to match the type of solder used. About 650F (345C) works well for lead-free 99Sn-0.3Ag-0.7Cu solder, but you can go higher - even up to 800F - when soldering components such as these that are not easily damaged by heat.
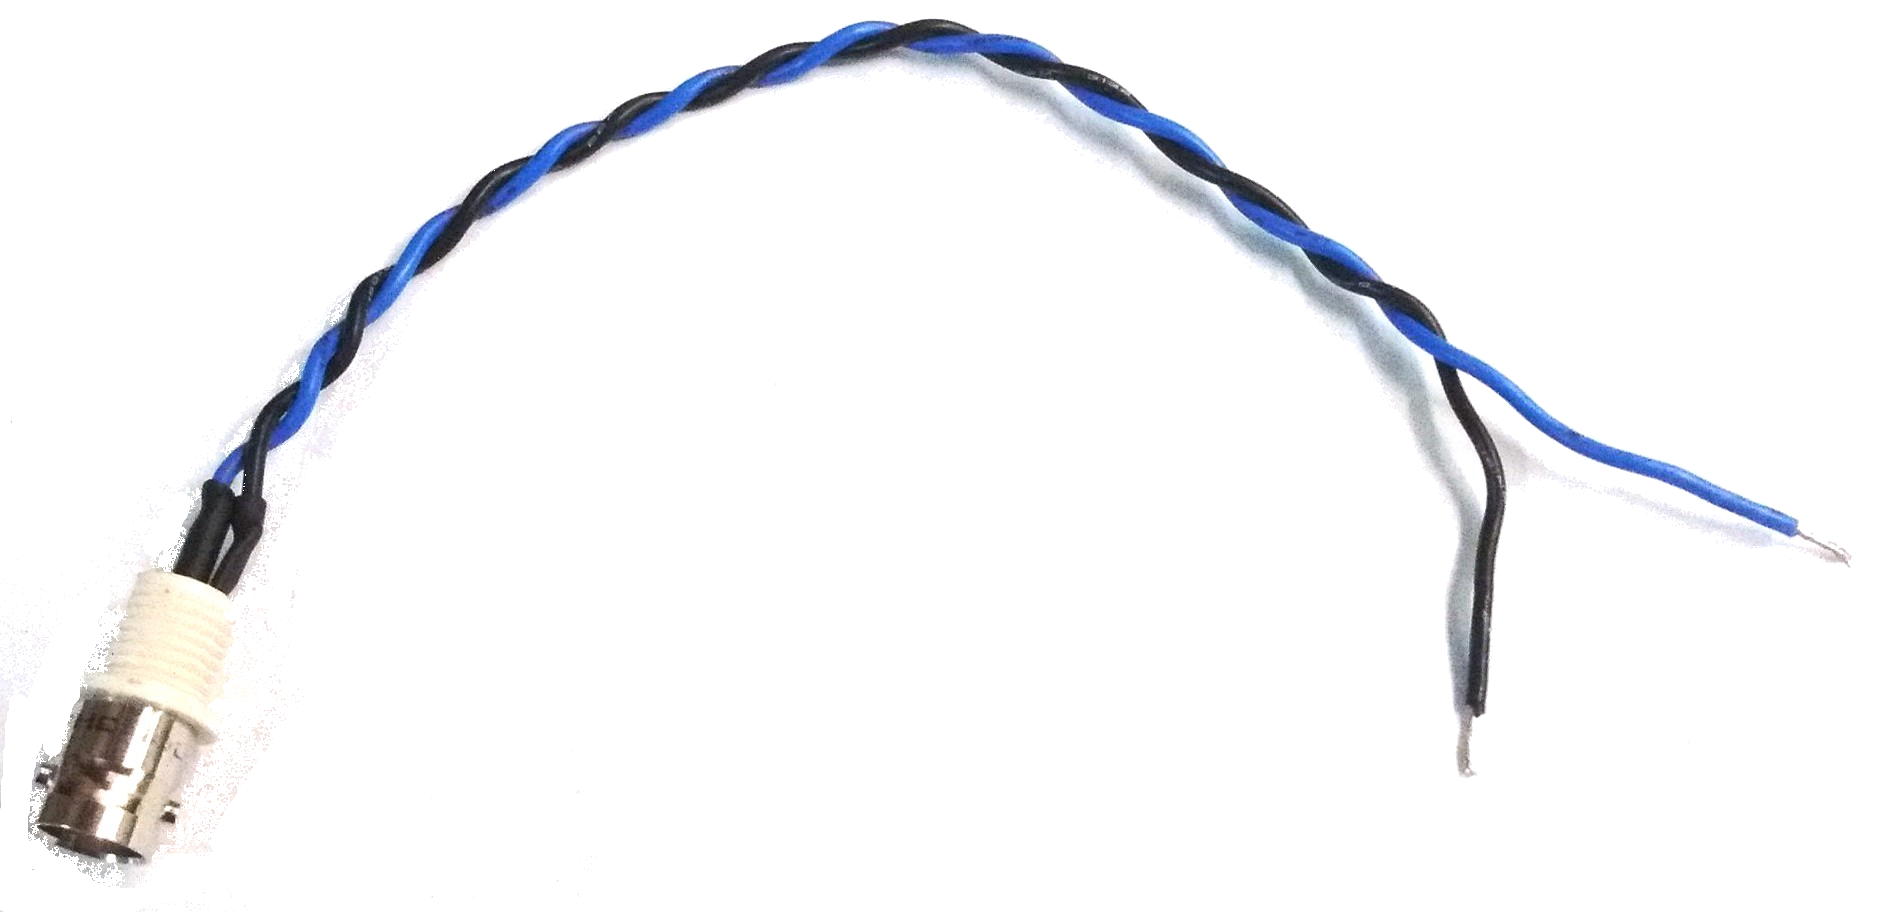
2-Wire-to-BNC adapter. Note that the pair of wires is twisted together to form a “twisted pair”. The connections between the wire and BNC connector can be covered in electrical tape or heat-shrink to prevent accidental shorting.
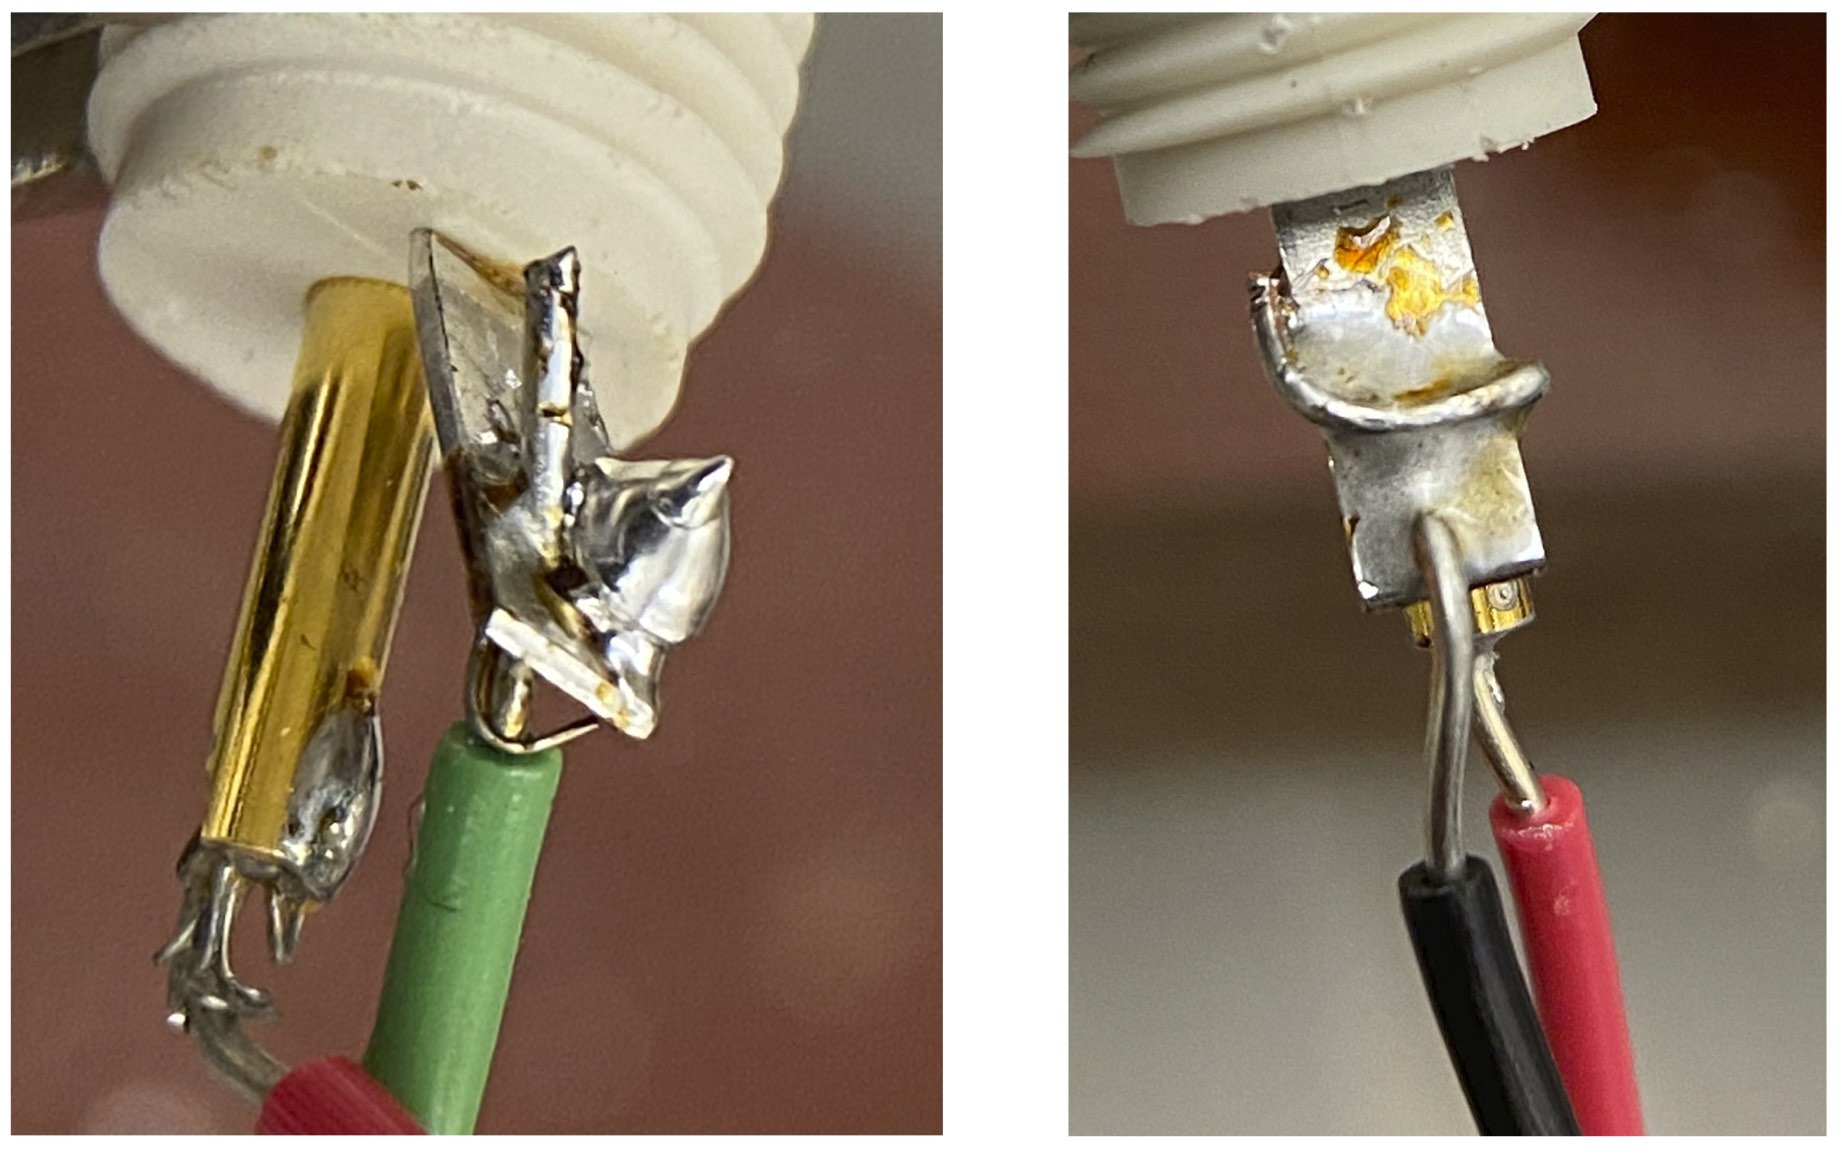
A bad (left) and good (right) solder connection. Hot melted solder will not flow over and bond to a cold metal surface, leaving a blob as shown on the left. It is best not to depend only on the metal-solder bond for mechanical strength, so the wire was wrapped around the tab on the right before soldering
R-1 Include a photo (similar to Fig. 2) of your soldered connector joints in your report.
Instrument refresher
Oscilloscope and Wave Generator
An oscilloscope is a sensitive voltmeter that can graph the voltage on one of its inputs as a function of time so that periodic and transient signals can be observed and measured. On all oscilloscopes, the controls can be grouped according to three basic functions:
- vertical (y) motion of the trace on the screen:
- vertical position
- vertical sensitivity (volts/div)
- Input Channel selection
- DC-AC-Ground input coupling
- horizontal (x) motion of the trace:
- horizontal sweep speed (sec/div)
- horizontal position
- time base circuitry that makes the x deflection into an actual time axis on the screen and synchronizes that time scale so that the position matches the time of arrival of the signals being measured:
- trigger level,slope, source, mode
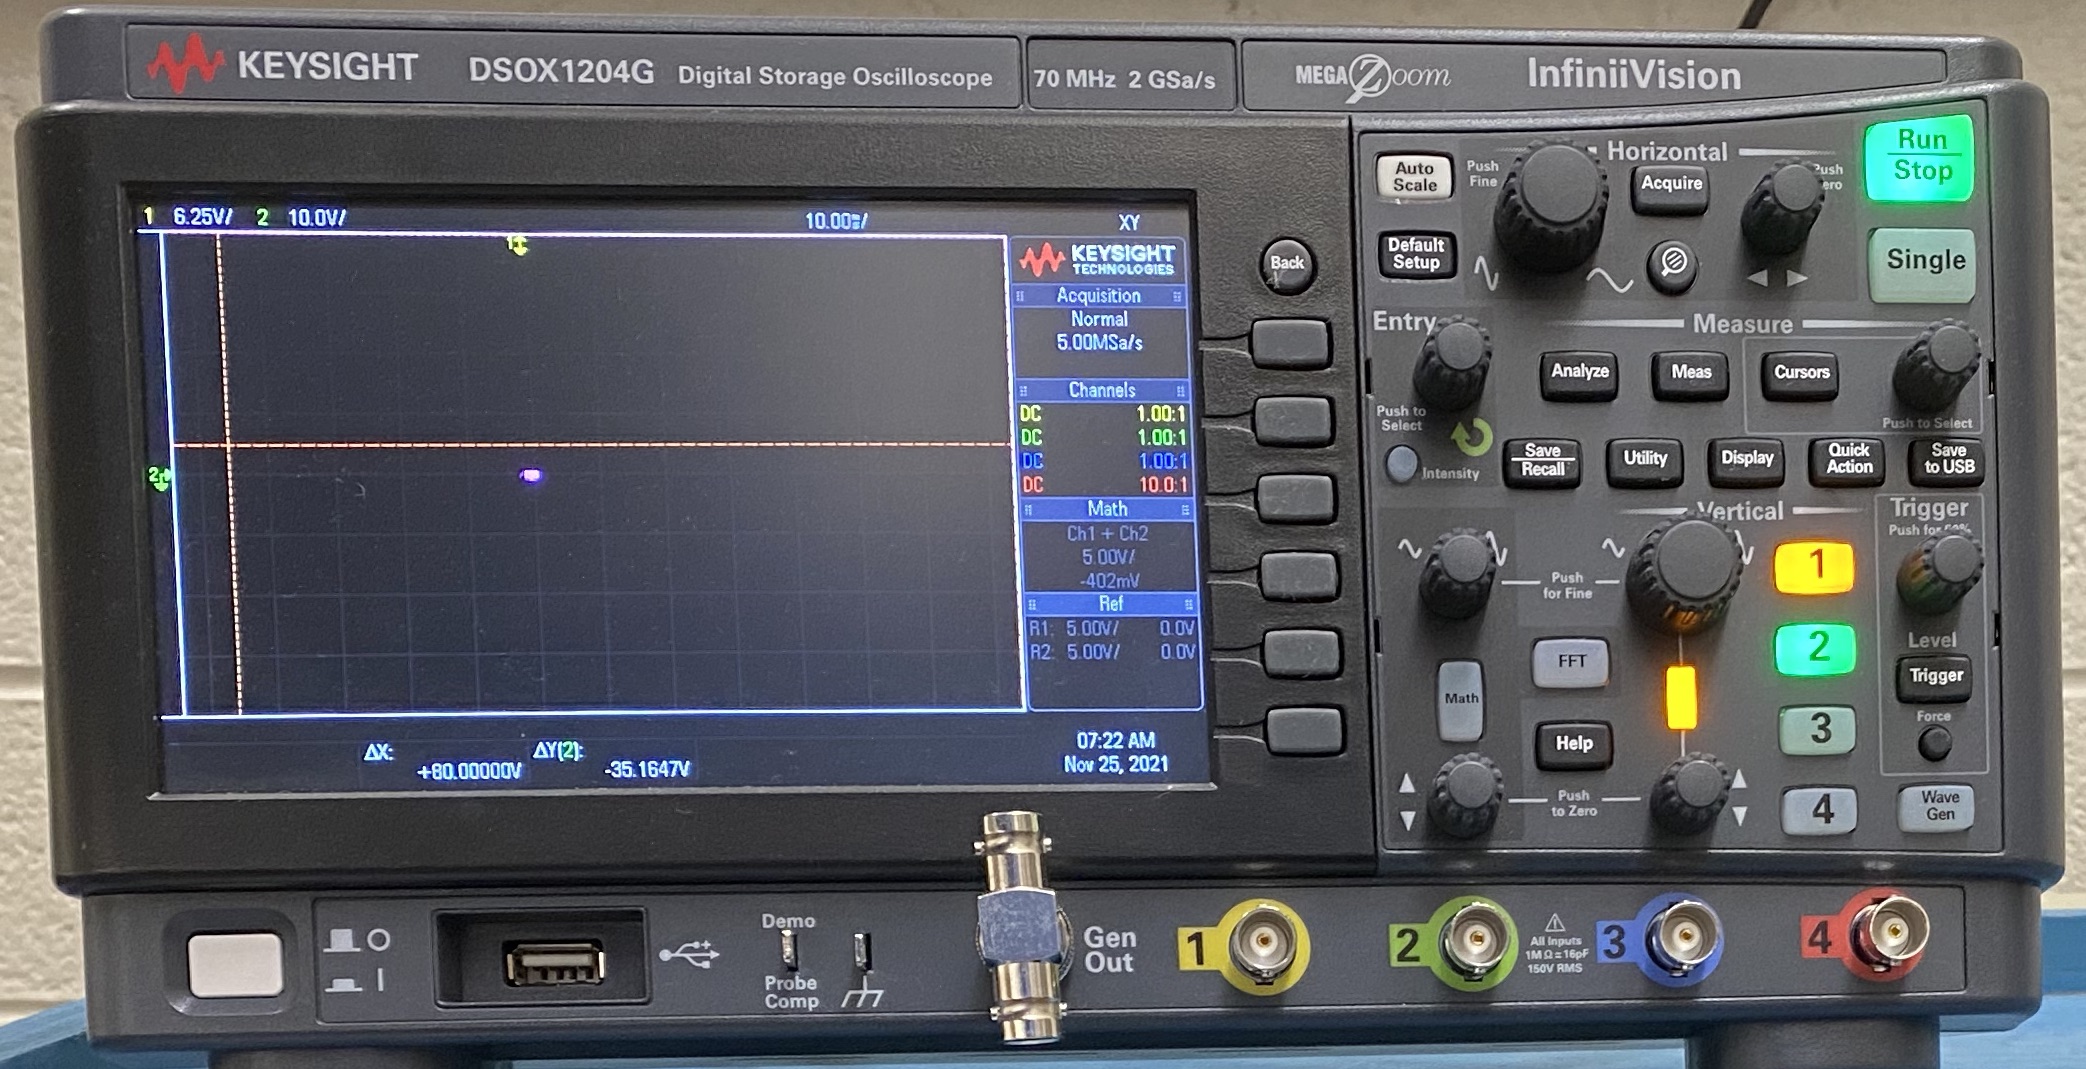
Keysight DSOX1204G oscilloscope
For your Keysight DSOX1204G oscilloscope, you can set the parameters for Horizontal, Vertical, and Trigger for each of the four input channels by pressing the appropriate button 1,2,3, or 4 and then using the unlabelled buttons next to the menu that appears on the right-hand side of the screen. The Entry knob is used to select various menu items.
The DSOX1204G includes a wave/function generator whose Gen Out menu can be accessed by pressing the Wave Gen button. Sine, square, ramp, and pulse waves can be produced with frequencies from 0.1 Hz up to (respectively) 20, 10, 0.1, and 10 MHz] and amplitudes up to 5 V peak-to-peak. The wave generator can also produce modest DC voltages, but a separate supply is needed for higher voltages and currents.
Multimeter
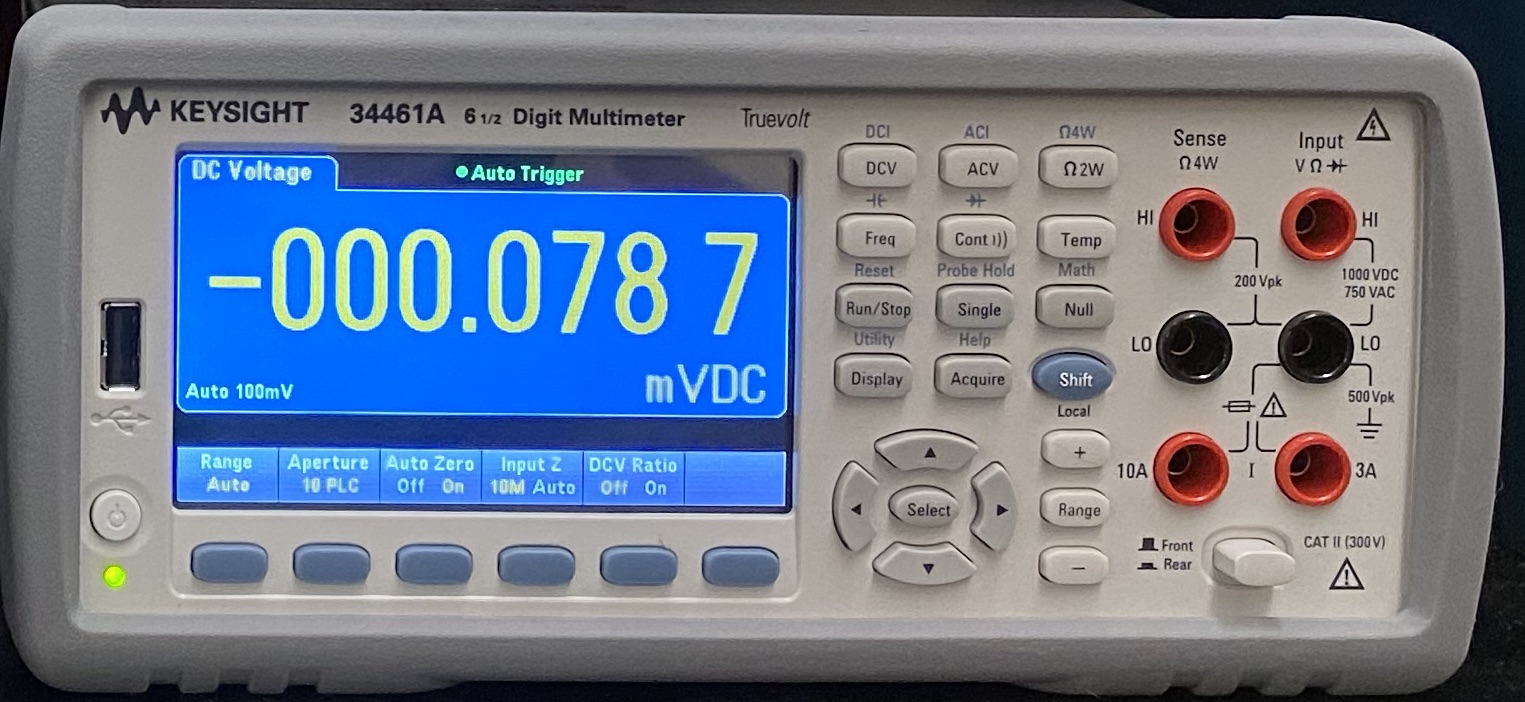
The Keysight 34461A Digital Multimeter can measure AC/DC current, AC/DC voltage, resistance, and capacitance with 6 1/2 digit precision. (“6 1/2” means there are 7 digits, but the first one can only be “0” or “1”, i.e the digits displayed can range from 0000000 to 1999999.)
Keysight 34461A DC power supply
DC Power Supply
The Keysight E36311A Triple Output Programmable Power Supply has 3 outputs with 1A maximum current: 0 to 6V, 0 to +25V, and 0 to -25V.

Keysight E36311A DC power supply
Turning On the Equipment
To start with, let’s produce and observe a 25 kHz, 2V sine wave.
- Press Wave Gen button
- Select Frequency on menu
- Change frequency using Entry knob.
- Select Amplitude, set to 2 Vpp.
Start up the oscilloscope
- Press power button (O/I) to turn oscilloscope on
- While oscilloscope boots up, connect Gen Out to the Channel 1 input with a BNC coaxial cable.
- The oscilloscope will remember settings from the last time it was used, so for a clear start press Default Setup.
- Generate desired wave
- Press Wave Gen button
- Select Frequency on menu
- Change frequency to 2 kHz using Entry knob.
- Note that the Entry knob has a non-linear response. If you want a big change you need to turn it fast.
- Select Amplitude, set to 2 Vpp.
- Change frequency to 2 kHz using Entry knob.
- Press Auto Scale button to let the scope automatically choose the settings to display the signal.
- WARNING: The AUTOSET button is helpful for initial set-up or to find a signal that may be off the screen, but should not be trusted with complex waveforms. For example, if a signal has both high and low frequency components, AUTOSET settings may show only one component and you won’t even realize others exist.
Modern digital oscilloscopes provide many measurement functions, so let’s explore.
- Press the Meas button to explore the range of possible measurements.
The oscilloscope screen should now be as shown in Fig. 3, where the yellow “trace” show the sinusoidal input signal on channel 1.
- The bottom of the screen shows the measured Frequency and Peak-to-Peak voltage
- Play with oscilloscope Vertical and Horizontal controls to confirm you understand what they do.
An oscilloscope needs a trigger to decide when to display a signal. To explore the scope trigger:
- Press the Trigger Menu* button.
- Press the Mode button.
- Auto will be highlighted and have a tick mark; underneath Auto you see Normal.
- In Auto mode the scope will always trigger, even if there is no input signal with the desired characteristics.
- Auto will be highlighted and have a tick mark; underneath Auto you see Normal.
- Rotate the Entry knob until Normal is highlighted.
- Press Trigger Type
- Make sure it is Edge.
- Press Trigger Type again and you can see and select the different trigger types.
- Rotate the Trigger Level knob and a horizontal line should appear on the screen.
- In Normal mode the scope will only display input signals that cross this line.
- Play around with the Level and the other trigger settings and see how it affects what you see.
Press Wave Gen again and play controls to learn what they do to the signal observed on the scope.Try a few controls:
- Waveform allows you to select Sine, Square, Ramp (triangle), Pulse, DC, or noise.
- Offset T changes DC level of the signal
Learn about the Cursors
- Press Cursors
- Play with Push to Select button to the right of the Cursors button.
Set Wave Gen to a \(\pi=3.1415\ldots\) kHz, 2.83 Vpp sine wave.
- \(2.83=2\sqrt{2}\) Vpp (peak-to-peak) corresponds to 1 Vrms (root-mean-square).
- Note that Amplitude Fine and Frequency Fine allow more precise settings.
Can your multimeter be trusted?
Turn on your multimeter
- Put a BNC T on the Scope WaveGen output.
- Use BNC-to-BNC cable to connect the T to scope Channel 1.
- Use BNC-to-banana-plug cable to connect the multimeter to the T.
- Press Freq button to measure frequency
- Press ACV button to measure RMS AC voltage
On scope, Press Meas
- Type
- AC RMS - N Cycles
- Add Measurement
Scope measurements jump around, so let’s average them:
- Acquire
- Acquire Mode
- Averaging
- # Avgs to 128 (values as high as 32768 are possible, but this much averaging could take a while).
Our multimeters don’t have the simple Average function that more expensive models do, but when needed, this provides the Average and other useful information.
- Shift-Math
- Statistics
- Clear Readings
Remember to Clear Readings every time.
R-2 Do multimeter and scope measurements of RMS voltage agree within their instrument specifications, e.g. the scope DC vertical accuracy?
Frequency Measurements
Set the Wave Gen Amplitude to 2.83 Vpp.
R-3 Measure (and report) the frequency response of your multimeter by recording its ACV voltage readings vs log frequency for constant sinusoidal source amplitude over a range of frequencies from 0.1 Hz to 20 MHz. Is it consistent with the multimeter technical specifications?
- Make sure Multimeter AC Filter (which should appear at bottom of screen when ACV selected) is set to >3Hz
- Use your oscilloscope to monitor the function generator output.
- To start with, make big steps (e.g. factor of 10). If something changes, you can go back to fill in gaps.
Breadboard warm-up
Circuits in this lab will be built using a solderless breadboard. Breadboards allow you to quickly swap out components, which is useful when you prototype a design.
You will often need short wires to make connections on the breadboard. To make these, use the wire strippers in your kit to cut some small lengths of wire and strip the insulation off the ends to expose the metal.
- A possibly helpful video on how to make short jumper wires is available.
Breadboard connections
Connect the Scope Channel 1 and DC power supply leads to figure out which sets of sockets on the squarish breadboard are connected internally.
- Note: Wires/cables connecting to an instrument are often referred to as “leads”.
- Don’t force wires into sockets. If a wire doesn’t insert easily, try straightening the end with small pliers. Inserting the wire with the pliers can also help. If the wire still doesn’t go in, move to a different socket.

Upper left corner of a breadboard
R-4 Annotate this photo of a corner of your squarish breadboard, clearly indicting how the sockets are connected, and include it in your report. (The photo can be downloaded from Quercus.)
- You don’t have to show how every single socket is connected, as long as the pattern is clear.
Real LEDs
Measure the LED thresholds
Use the E36311A DC power supply to measure the threshold voltage for a blue and a red LED, i.e. the voltage applied across the LED at which it just starts to glow.
- Use the LEDs with clear plastic covers.
- Be especially sure to use the CLEAR RED 20ma LED, NOT the 4223 red LED Indicator LEDs with red plastic opaque covers.
- The 4223 LED has some special properties that we are saving for later use.
- Too high a voltage across an LED will make it very hot and can can destroy it, so never apply a voltage beyond what is needed to get reasonably (i.e. not painfully) bright LED flashes.
R-5) What is the minimum peak voltage needed to make the LEDs glow visibly?
- The red and blue may have different glowing thresholds.
- This is a physics lab course, so never forget to estimate and report uncertainties when appropriate.
Create and run the flasher circuit on your breadboard.
Use the LEDs you’ve measured to build on your breadboard the circuit you simulated in the previous Lab S that alternately flashes an red and a blue light emitting diode (LED) a couple of times a second. Power the circuit with your scope waveform generator.
- Note that it is is much easier to debug circuits if the wires have a consistent colour scheme, so circuit connections can be more easily seen and followed. As much as possible, try to use the same colour for wires that are at the same potential. We recommend the following conventions:
- black: ground/common/earth
- red: signal / positive DC
- blue: negative DC
- Since each member of a pair may have different designs, flip a coin to try one first.
- If a design doesn’t work, it may need revision.
R-6) Make a short (<10 second) video showing the the circuit with LEDs flashing, and submit via Quercus along with your report.
- Only use a Vpp (peak-to-peak voltage) sufficient for the LEDs to flash brightly in your video.
- Be sure to specify the value of the resistor, and the waveform, frequency, and Vpp used to drive the circuit.
- The size of your video file should be <10MB (mine was 1.1 MB); 720p is more than enough resolution.
Clean-up at end of lab
- Hang any cables you have used back on the wall.
- Return components to bins. Be careful to return the LEDs their correct bin. You can’t tell the blue from red when they are not flashing.
- Properly dispose of any waste, e.g. wire or insulator cuttings.
- Make sure oscilloscope, DC power supply, and multimeter are turned off.
- Be sure that the work station is as clean as you see it on the first day of the lab. Not returning the work station to its original status will lead to 50% deduction of the in lab execution point.
- "I will come back in an hour" is not a good reason for not cleaning up...
Be sure to read the Report guidelines before writing your report.
See you next week!