PHY405 Electronics, Lab 2
Adapted from Prof. David Bailey's website in 2022
Overview
Measurements of circuits with resistors, capacitors, and inductors.
- Internal resistance
- RC and RL Circuits and Filters
- Computer control of instruments
Read over the whole lab write-up before starting, since knowing what comes later sometimes helps earlier.
Background preparation before starting the lab
Read through all these Lab instructions before Lecture.
- You will be building a real circuit that you previously simulated, so be sure you have access to the link to your circuit so you can build it and revise it if necessary.
- If you want to control your instruments from your own laptop, be sure you have pyVisa installed.
- You may not be able to finish in time if you only read these instructions after arriving in the lab.
- Ask questions at the Lecture or look things up before the lab.
- If asked to design a circuit or watch a video or look up some instrument specifications. Do this before the lab.
Remember
- By plotting data as you take it, you can avoid taking more data than you need.
- Note any anomalies.
Safety
It is possible your components may get very hot and produce small amounts of smoke.
- The small resistors and LEDs in this lab are usually rated for only a fraction of a watt, so be careful if putting more than that across a component.
- When applying voltages across resistors, remember that \(P=V^2/R\).
- When applying voltages across LEDs, remember that \(P=IV\).
- If something starts to smoke, turn off the power.
- When changing a component, be cautious in case it is hot.
Be careful not to stare at an LED if it gets very bright.
Exercises
Internal resistance
It is important to understand the characteristics of your instruments, since they become part of any circuit they are attached to. Knowing the limitations of your instruments can help you avoid embarrassing mistakes.
An ideal power supply would have zero internal resistance and could output infinite current. Real power supplies have limits due to internal resistance, internal impedance, and internal controls intended to prevent damage to the supply.
- Real instruments and devices all have non-zero capacitance and inductance, but these can be neglected for DC measurements.
- These electrical characteristics can depend on the instrument settings.
R-1 By measuring how the output voltage drops across an external shunt resistor (Fig. 2), determine the Internal Resistance of the E36311A DC power supply on its -25V Volt output port.
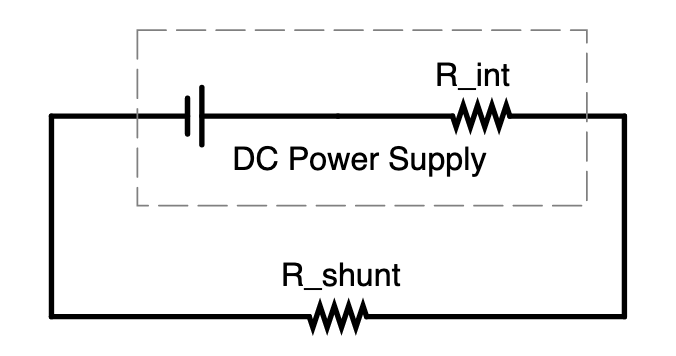
- The internal and external resistances form a resistive divider, where the voltage across each resistance is proportional to the relative size of the resistance.
- The internal resistance is small, so to see a voltage drop you’ll want to use smallish shunt resistors and measure the voltage drop with the best precision possible to see small changes.
- WARNING!!! If you put too much voltage across a resistor it may start smoking, so DO NOT put more voltage across a resistor than it can handle. (Remember that \(P=V^2/R\).)
- Use a resistor colour code chart or calculator to confirm the resistor values and determine their tolerances.
- Never assume that all components in a drawer match the label on the drawer.
- You can check the value of a resistor or capacitor with your multimeter.
- -25V refers to the port, not necessarily the voltage you're using. Pick the voltage/voltages that you think make the most sense.
- Consider using multiple shunt resistors if that helps you reducing the uncertainties.
AC Impedance
Create an RC divider with a 22nF ceramic capacitor and a 10k resistor in series.
- This can act as a high-pass or low-pass filter, depending on whether the Output is taken across the resistor or the capacitor.
- Before creating the circuit, use your multimeter to precisely measure the capacitance and the resistance.
R-2) What is the measured capacitance of the nominal 22nF capacitor and measured resistance of the nominal 10k resistor?
Apply a 2V Peak-to-Peak sine wave across the divider and observe the peak-to-peak outputs across the whole divider (Channel 1) and across the resistor (Channel 2). Channel 1 shows the Input to the circuit and Channel 2 shows the Output voltage across the resistor. In a linear circuit such as this, the output will have the same frequency as the input, but may have a different amplitude and relative phase.
- If one of the outputs is fuzzy/thick, you may want to use the BW Limit that limits the bandwidth to filter out high frequency noise.
The attenuation or amplitude frequency response is
\[ A(f) = \frac{|V_{output}(f)|}{|V_{input}(f)|}\]
- The 3 dB frequency is where the attenuation is \(1/\sqrt{2} \approx 0.7\).
- In an RC circuit, the 3 dB radial frequency corresponds is the inverse of the RC time constant.
- Unless otherwise specified, “frequency” means the ordinary frequency \(f\), not radial frequency \(\omega=2\pi f\).
Both the amplitude and phase can change between the input and output of a circuit, so we are more generally interested in the transfer function:
\[H(f)=\frac{V_{output}(f)}{V_{input}(f)}=|H(f)|e^{i\phi(f)}\]
R-3) By hand, measure and make loglog plots of attenuation vs frequency and phase vs frequency.
- Set up measurement functions on your scope so you can quickly read \(V_{Ch1}(f)\), \(V_{Ch2}(f)\), and \(\phi_{Ch2}(f)-\phi_{Ch1}(f)\).
- It is fastest to initially choose logarithmic frequency steps, e.g. 10 Hz, 100 Hz, 1000 Hz, …, and then decide if more data points would be useful in some range.
R-4) Is the observed \(H(f)\) quantitatively what you expect?
- Any deviation from expectations for \(H(f)\) are likely because the breadboard has capacitance and inductance that become important at higher frequencies.
Frequency Response: Bode Plots
The above transfer function plot of the amplitude and phase frequency response of a circuit is known as a Bode plot. There are several ways to do it faster.
Before the lab, watch this video on Bode Plots on an Oscilloscope: The Old Way vs. The New Way from the Keysight Oscilloscope 101 Playlist.
Use the scope’s analysis functions to make a Bode plot of the same circuit.
- Press Analyze
- Rotate Entry until Frequency Response Analysis (FRA) is selected
- Setup
- Start Freq to 10.0 Hz
- Stop Freq to 20.00 MHz
- Amplitude 1.00Vpp
- Output Load High-Z
- Points 36 (Need to use Fine)
- Back
- Run Analysis
R-5) Do these measurements agree with your previous measurements made by hand? Include a screen capture or photo of the scope display of the Bode plot.
Computer Control of Instruments
Your instruments can all be controlled through their rear USB ports by either the lab computer or your own (almost certainly faster) laptop. This can be very helpful when taking many measurements, and it is convenient not to have to transfer data from the lab computer.
To use your own computer, you will need to install the NI-VISA libraries and pyvisa
- https://pyvisa.readthedocs.io/en/latest/faq/getting_nivisa.html
- In Spyder console window type “pip install -U pyvisa” and then restart the Kernel.
Note: The scope’s front USB port is only for downloading data onto a USB key. It cannot control the scope.
Use PHY405_Test_USB_Control.py to test controlling the equipments with your computer.
Use PHY405_Bode_Plot_Analyze.py to make a third plot of your circuit.
R-6) Does this plot agree with your previous measurements? Include the output Bode plot in your report.
RL Circuit
Capacitors are usually much cheaper, more compact, and radiate less electromagnetic noise than inductors, so when possible capacitors are usually preferred. Inductors, however, are often the best choice for high power applications and are found in almost every power supply.
Replace the nominal 22nf capacitor with a nominal 12mH inductor. Taking the output across the inductor, make a Bode plot using whichever of the above methods you prefer.
R-7) Is the Bode plot as you expect?
Band-pass Filter
in Lab S you combined low-pass and high-pass RC filters to design a band-pass filter that allows only a range of frequencies to pass. Build this filter and see if it lights up a Green LED only when the circuit is driven by a 6Vpp input frequency is (roughly) between \(\sim 0.5 \mathrm{kHz}\) and \(\sim 5 \mathrm{kHz}\).
- The LED may not be very bright. You can actually go a bit above 6V if it helps you see the LED light.
- Use the LEDs with green plastic covers.
- You may need to revise your design:
- If we don’t have the values of R and C that you chose. e.g. If the capacitor in your design is more than \(1\mu F\), be prepared to reduce the capacitance and increase the resistance to get the same RC values.
- If the design does not work. e.g the resistor is so small that \(V^2/R\) heating fries it.
R-8) Include a circuit diagram or Falstad simulator screen capture of the circuit with all components clearly specified, and a photo of your working circuit. Very briefly explain how you chose your component values, and discuss how well it worked.
End of Lab
Clean-up
- Properly dispose of any waste, e.g. wire cuttings or insulator cuttings
- But keep any small connector wires you may have made, they will be useful over the semester.
- If a component has been damaged, e.g. it smoked because of overheating, dispose of it.
- Turn off all equipment.
See you next week!