PHY405 Electronics, Lab 7
Adapted from Prof. David Bailey's website in 2022
Overview
- Voltage multiplier
- Using an LED as a very inefficient Single Photon Avalanche Diode (SPAD).
- Detecting fast pulses
- Arduino digital inputs
It is best to read over this whole write-up before starting; knowing what comes later may help you earlier.
Parts of this lab were inspired by:
- McCann, Lowell. “Introducing students to single photon detection with a reverse-biased LED in avalanche mode.”, 2015 Conference on Laboratory Instruction Beyond the First Year of College,.
- Newport, Jonathan. “LEDs as Single-Photon Avalanche Photodiodes.”, 2018 Topical Conference on Laboratory Instruction.
Safety Reminders (for both humans and electronics)
Arduinos and LEDs can be fried by >5V, and in this lab you will be using voltages over 25V!!
- Be very careful your circuits are correct, with protective capacitors and zeners installed.
Do not multiply voltages to values larger than 30V!
- Unless applied under the skin, voltages up to 30V are usually safe because normal dry skin resistance prevents dangerous currents from flowing through the human body.
Exercises
Cockcroft-Walton Voltage Multiplier
This lab requires about 25V DC. We could use our DC power supply, but what if we want a portable battery powered instrument? We’d need a voltage multiplier that converts a lower voltage into a higher voltage.
- Voltage multipliers conserve energy, so higher output voltage means lower output current. This is not an issue here since the output current of our single photon avalanche detector is negligible.
The simplest voltage multipliers are built from capacitors and diodes. One common configuration is the Cockcroft-Walton Voltage Multiplier.
- Cockcroft and Walton were the first scientists to“split the atom”, using their eponymous voltage multiplier to accelerate protons to 600 KV . They won the Nobel Prize in Physics in 1951 “for their pioneer work on the transmutation of atomic nuclei by artificially accelerated atomic particles.”)
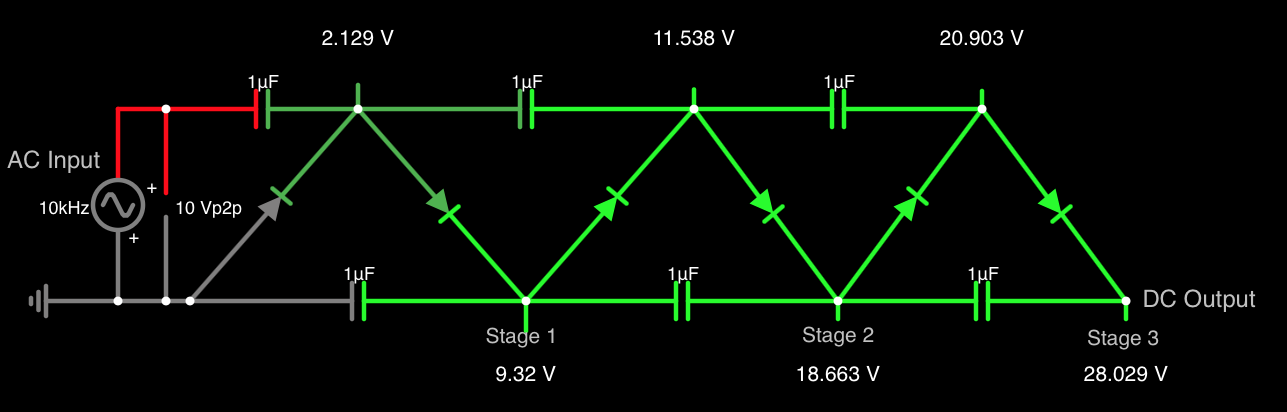
A Cockcroft-Walton Voltage Multiplier, that can be built with 1N4005 Rectifier Diode and 1uF ceramic capacitors. Use the Wavegen to supply the AC Input.
Do not start with 10 V! Read the whole lab manual, start from low voltage, and go up. Verify your circuit before connecting AC input!
Build the above circuit on your breadboard.
- The circuits in this lab will be connected together, so be sure to plan a sensible layout.
- Diodes have a direction and must be inserted the right way around.
- Diode cases have a stripe around one end indicating the - side.
- In general, If a component has a longer leg, than that is the + side.
- Your circuit will have a lot of closely packed components. Be very careful there are no unintended shorts caused by component legs accidentally touching each other.
- Connect the Wavegen last.
- Set the Wavegen to 100mV Amplitude, 10kHz Sine before connecting it to the circuit.
- You can get a slightly higher DC output with a Square wave, but I noticed this produced noise spikes elsewhere on the board every time the voltage switched from + to -.
While monitoring the voltage multiplier DC Output, turn on the Wavegen and slowly increase the Amplitude.
- With 1V WaveGen Amplitude, the DC Output should be about 3V.
- If not, stop and check your circuit for correct component orientations, accidental connections or leads not properly inserted into breadboard sockets.
- It can take some time for the capacitors to discharge after the AC power is turned off, so it is safest to wait a minute before making any changes to circuit components.
- As long as everything seems okay, while monitoring the voltage multiplier DC Output, slowly increase the WaveGen peak-to-peak Amplitude to 10V, where the DC Output should be >25 VDC.
R-1) Include a photo of your Cockcroft-Walton Voltage Multiplier circuit.
R-2) With the Wavegen amplitude at 5V, what is the measured DC Output of your Cockcroft-Walton Voltage Multiplier?
Single-Photon Avalanches
Surprisingly, some types of red Light Emitting Diodes can work as (very inefficient) Single Photon Avalanche Detectors (SPAD) at voltages as low as 20-25V.
- As discussed in the Lecture, a SPAD is a detector where the electron and hole produced by a single photon interaction are accelerated sufficiently by the electric field in the diode to produce new electron-hole pairs which are in turn accelerated producing more electron hole pairs, etc., causing an “avalanche” of charge carriers producing an easily detectable signal pulse.
- It is not obvious why certain red LEDs work as low voltage SPADs, but I believe the ones that do work are all made from Gallium phosphide (GaP), instead of GaAlAs, InGaAlP, or GaAsP which are used in other common red LEDs. I am not aware of LEDs of any colour other than red that work as SPADs, at least not at voltages low enough to be considered reasonably safe.
Create the voltage divider circuit below with a LTL-4223 2.5V / 10ma red LED.
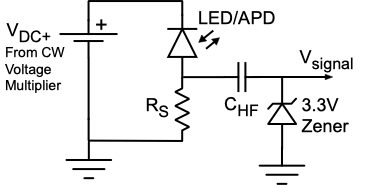
Reverse biased LED circuit using DC voltage from Cockcroft-Walton Voltage Multiplier to provide bias voltages > 20V. The capacitor (\(\sim \mathrm{0.1-1 \mu F}\)) filters out DC voltages and the 3.3V zener diode protects the later Arduino inputs. 10k is a reasonable value for the signal resistor \(R_S\)
- Be sure the zener is right way around to protect the Arduino inputs!
Turn off the WaveGen off and confirm that the output voltage of the Cockcroft-Walton is zero, then connect the Cockcroft-Walton DC output to this circuit.
Once everything looks good, set the WaveGen to 500mV Amplitude, 10kHz Sine, turn it on, and slowly increase the Wavegen amplitude while monitoring the Cockcroft-Walton \(\mathrm{V_{DC}+}\) and \(\mathrm{V_{signal}}\) on your Scope.
- Watch the LED as you slowly turn up the Amplitude. If it glows - stop!! A glowing LED means it is in the forward direction. Turn off the Cockcroft-Walton, reverse the LED and try again.
You are looking for fast positive signals with amplitudes and widths of order 100 mV and 10 microseconds. You should not see any such pulses when the bias voltage \(\mathrm{V_{DC}+}\) is less than about 20V. Continue slowly increasing \(\mathrm{V_{DC}+}\). Somewhere in the range 20 - 25 V you should start to see narrow (\(<\mathrm{\sim 5-50 \mu s}\) wide) pulses, something like this:
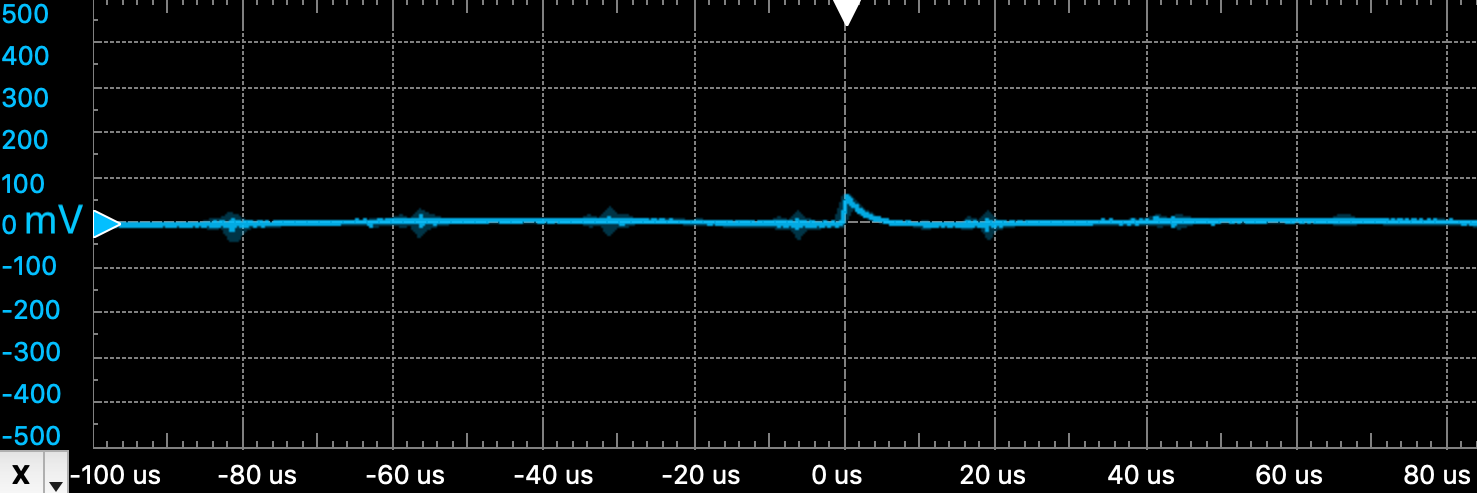
Small pulses produced when the reverse bias voltage across a red LED is just enough for single photon avalanches to start.
If you increase the voltage by another few tenths of a volt or so the pulses should become very broad, continuous, or multipulsing like this:
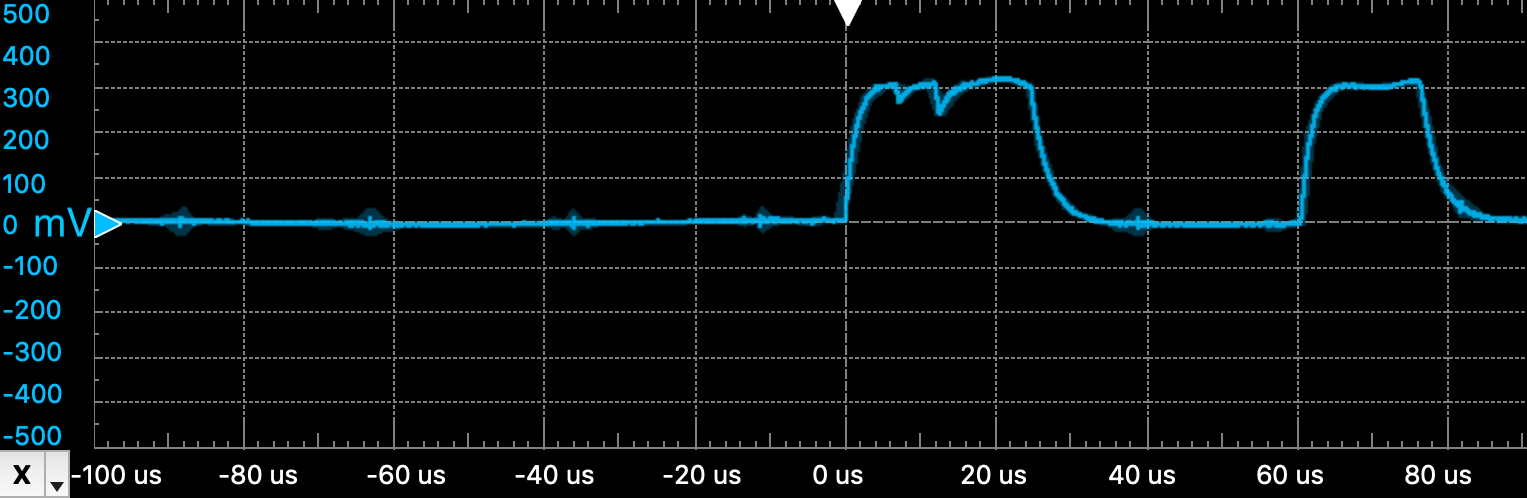
Broad pulses produced when the bias voltage is so large that multiple avalanching occurs. The plateau is at the maximum signal voltage the circuit can produce.
Reduce the voltage back to the value where you see narrow pulses (as shown below)that just reach the maximum signal voltage.
- This may require a delicate touch. The spread in WaveGen amplitude for the above 3 figures was less than 0.1 V. Changing the Wavegen amplitude by as little as a 0.01 V can make a noticeable difference.
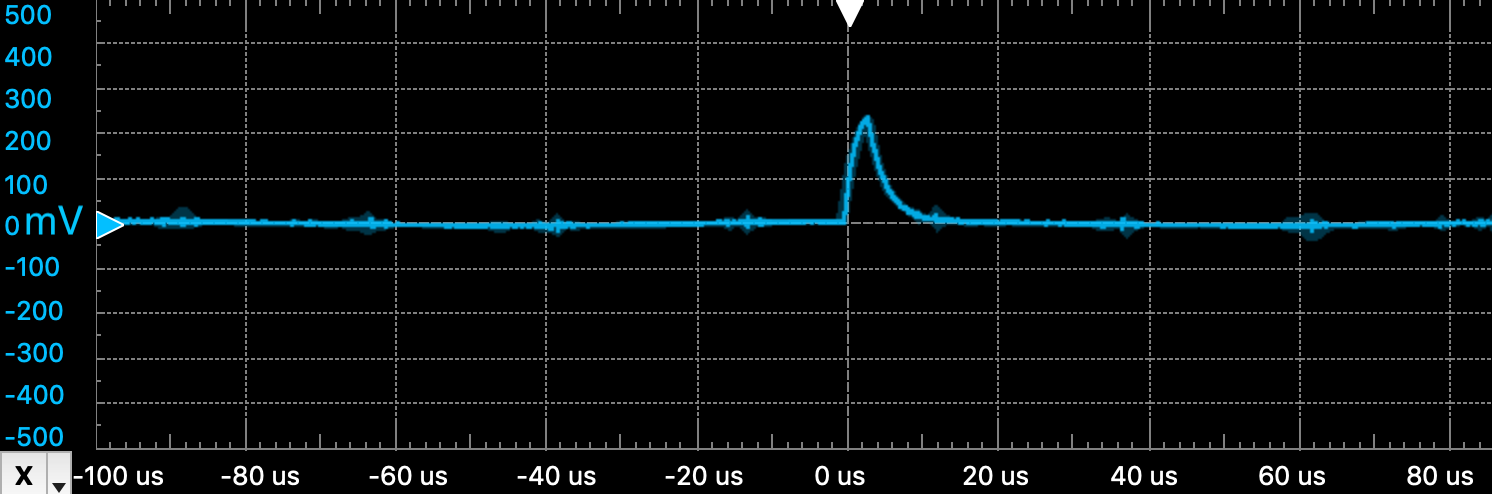
Nice pulses produced when the reverse bias voltage across a red LED is just right.
Create an removable cover for your LED with opaque (e.g. thick black) paper and tape. Confirm that the pulse rate is much reduced when the LED is covered, implying that light is causing the pulses. Each pulse is caused by an charge avalanche within the reverse biased LED, and (ideally) single photon induced avalanches should be the usual cause.
R-3) What is the bias voltage (\(\mathrm{V_{DC}+}\)) at which you get nice pulses?
- The quality of the pulses changes very quickly with voltage, so you’ll have to use Amplitude Fine when making adjustments near the threshold for pulsing.
R-4) Include a scope screen image of a nice pulse.
Analog Pulse Counting
Connect \(\mathrm{V_{signal}}\) to an Arduino analog pin. Using CountAnalog_DCB.ino as a basis, measure the rate at which pulses are observed on the analog pin. You can analyse the data by copying the output printed on the Arduino Serial Monitor window and pasting it into a spreadsheet or text file on the computer.
- Stopping Autoscroll in the Serial Monitor makes copying easier.
R-5) What are the average analog pulse rates (counts/second) over a minute or two with the LED uncovered and covered?
Discriminators
In electronics, a discriminator is a circuit that accepts analog input pulses and puts out a signal or takes some other action if the input pulse has the right characteristics. For example, an oscilloscope has a discriminator that tells the scope to display the input if its value crosses some threshold value.
Instead of (or in addition to) feeding the SPAD \(V_{signal}\) into Scope or an Arduino analog pin, feed it into the the discriminator circuit below. The circuit uses a LM293P Differential Comparator that is a specialized op-amp designed to output a positive current if \(\mathrm{V_{IN+}}>\mathrm{V_{IN-}}\) and zero otherwise.
- The LM293P pin assignments are visible in Fig. 5-1 of the spec sheet.
- Since this is an op amp, the usual bypass capacitor is needed for \(\mathrm{V_{CC}}\), as shown in Fig. 10-1 of the spec sheet. This capacitor serves as the logic capacitor (\(\mathrm{C_L}\)) required according to spec sheet Fig. 7-1.

Discriminator circuit using an LM293P comparator to output a 5V digital logic pulse when the input voltage exceeds the value set by the \(\mathrm {\sim 10\,k\Omega}\) potentiometer \(\mathrm{R_{disc}}\). Choose a feedback resistor \(\mathrm{R_{fb} \sim 1\,k\Omega}\).
- Use \(\mathrm{V_{CC} = +5VDC}\) from the Arduino.
- The Arduino digital voltages values corresponding to 0 and 1 are conveniently \(0V\) and \(+5V\), so \(\mathrm{V_{CC}}\) and \(\mathrm{V_{LOGIC}}\) (see spec sheet Fig. 8-1) can use the same +5VDC supply.
- The pull up resistor connected to \(\mathrm{V_{LOGIC}=+5V}\) is needed so the output of the comparator is +5VDC when the signal voltage is greater than the discriminator set voltage.
Observe both \(\mathrm{V_{signal}}\) and \(\mathrm{V_{out}}\) on your oscilloscope. Adjust the discriminator potentiometer (\(\mathrm{R_{disc}}\)) until (roughly) rectangular +5V digital pulses are observed on \(\mathrm{V_{out}}\) in coincidence with the narrow analog pulses observed on \(\mathrm{V_{signal}}\).
Cockcroft-Walton tweak
Complicated circuits are the result of evolution. You build a circuit that you think will do what you want, and when it doesn’t work the way you hoped, you modify it.
- The 47k \(\mathrm{R_{fixed}}\) resistor was added when I realized that we could get finer control than just using the trimpot by itself, and it would also reduce the current drawn.
If you remove Scope probe from monitoring the the Cockcroft-Walton (CW) output:
- The multiplier output may shift slightly, so you may have to tweak the Wavegen amplitude. - More disconcertingly, CW voltage may not change when the Wavegen Amplitude is turned down, or even off! This is because when the scope lead is removed, the only way for the CW circuit capacitors to discharge is through the LED and that rate is extremely small. In order to be always able to adjust the CW output voltage up and down, we should add a large resistor to the output, as shown below. This is often referred to as the "Bleed resistor", common for safety reasons for high voltage applications.

A Cockcroft-Walton Voltage Multiplier with a 1M output resistor.
R-6) Include a Waveforms screen capture of a nice digital pulse from your discriminator circuit on one scope channel, and the corresponding analog pulse on the other channel.
Digital Pulse Counting
Connect \(\mathrm{V_{out}}\) to Arduino digital pin 2. Using CountInterrupts_DCB.ino as a basis, measure the rate at which pulses are observed on the digital pin 2.
- You can analyse the data by copying the output printed on the Arduino Serial Monitor window and pasting it into a spreadsheet or text file on the computer.
R-7) What are the average digital pulse rates (counts/second) over a minute or two with the LED uncovered and covered?
They digital reading is faster than analog, so the rate is likely to be faster, but a detailed understanding would require some investigation, e.g. see Final Project ideas later.
R-8) Include a photo of your whole breadboard with all the connected circuits and the Arduino with connections to the breadboard.
End of Lab
Looking Towards Final Project
This week’s exercise could again be the basis for a final project. For example, could you:
- Power the Cockcroft Walton with a DC supply + oscillator chip (e.g. the NE555P used in the next lab)
- Make the pulses narrower, larger, with less afterpulsing, …?
- Speed up the analog and/or digital read rates.
- Understand the difference between the analog and digital uncovered count rates?
- Are the observed variances of the analog and digital uncovered counts consistent with random pulse intervals? If not, can this be understood and modifications to the circuit or code made to make the pulse intervals more random?
…
Clean-up
- Properly dispose of any waste, e.g. wire or insulator cuttings
- But keep any small connector wires you may have made, they will be useful over the semester.
- If a component has been damaged, e.g. it smoked because of overheating, dispose it.
- Turn off all equipment.
See you in the next lab!