Abstract
Clusters of recurring, nearly identical microearthquakes
have been recorded near Loma Prieta, California.
Such events make possible direct measurement of temporal changes
in the attenuation operator t* along fixed paths
under what are tantamount to laboratory conditions.
Analysis of almost 10 years of P-wave data
following the 18 October 1989 Loma Prieta, California,
mainshock (M = 7.0) reveals a large-amplitude t* increase
within the first three weeks of the mainshock.
A gradual t* recovery towards its pre-mainshock level is seen
in the years ensuing.
The results point to changes in porosity and fluid saturation
taking place in parts of the mainshock source volume,
stemming from coseismic crack opening
and postseismic relaxation processes
such as postseismic fluid flow into the cracks, crack healing,
and rock compaction.
The real significance of this work is the following:
- We have developed a precise method to measure temporal changes
in wave medium attributes at seismogenic depths
under pseudo-laboratory conditions
— without the use of controlled seismic sources
- Due to their much stronger temporal variations
in a mainshock rupture zone,
temporal changes in seismic attenuation can be monitored
far more reliably than the corresponding changes
in P and S wave velocities or in the Vp/Vs ratio.
- Data permitting, an extension of the post-mainshock analysis
to pre-mainshock analysis presents a potential opportunity
to identify a strong earthquake precursor.
Figure 1:
Map of the Study Area.
The grey area delineates the approximate extent
of the Loma Prieta rupture zone.
The brown lines represent major fault traces.
A red star indicates the location of the multiplets
p1, p2, p3, and p4.
The yellow triangles indicate the sites of the NCSN stations
used in this study.

Figure 2:
Multiplet p2 waveforms at four representative stations.
Similar waveforms are recorded at both HFP and BVY.
The large differences between these two adjacent stations
are mostly due to site effects.
At HFE the waveform changes subtly
with the event.
At JTG, across the rupture zone from p2,
it changes more noticeably.
The 2.56-s long bracket marks the windowed segment
used for spectral analysis.
All data have their P-onset times aligned
and their amplitudes normalized.

Figure 3:
Multiplet earthquake locations.
The straight line xx' approximately parallels
the fault strike of the Loma Prieta earthquake.
These four plots show
(a) the NCEDC epicentral locations;
(b) the depth distribution along xx'
of the NCEDC hypocentral solutions;
(c) the double-difference epicentral locations;
and
(d) the depth distribution along xx'
of the DD hypocentral solutions.

Figure 4:
Representative Dt* measurements.
The blue lines and brown lines pertain to event 1 and event 3.
The numbers 3, 5, and 7 correspond to
three 2p, five 3p,
and seven 4p prolate sequences.
Following the Loma Prieta earthquake,
the t* did not change along the p2-HFP path.
It changed slightly along the p2-HFE path.
Along the p2-JTG rupture-zone path the t* changed significantly.

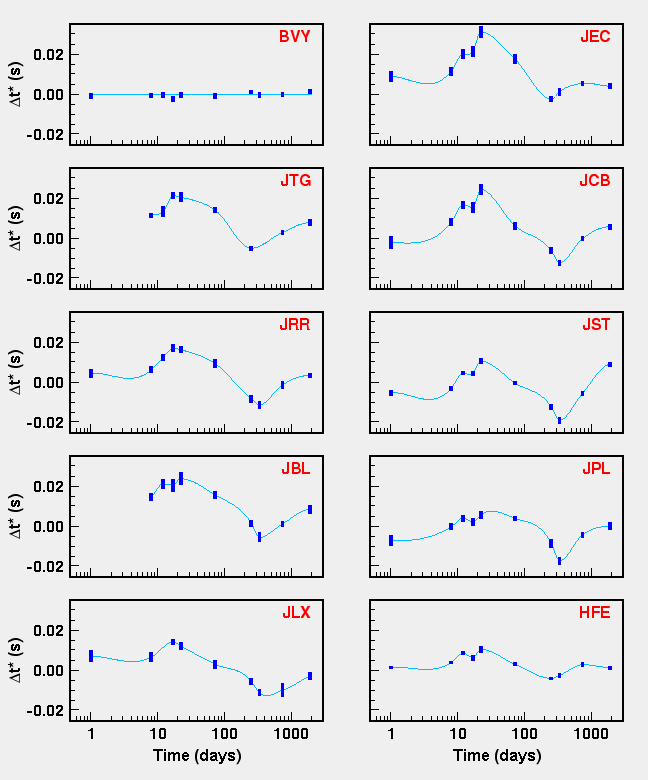
Figure 5a:
Dt* summary.
Temporal variations in t* along the propagation paths
from p2 to ten NCSN stations.
Each vertical bar is ±1s,
derived from the least-squares fitting of a straight line
to the spectral ratio.
Days are measured from the date of the Loma Prieta earthquake.

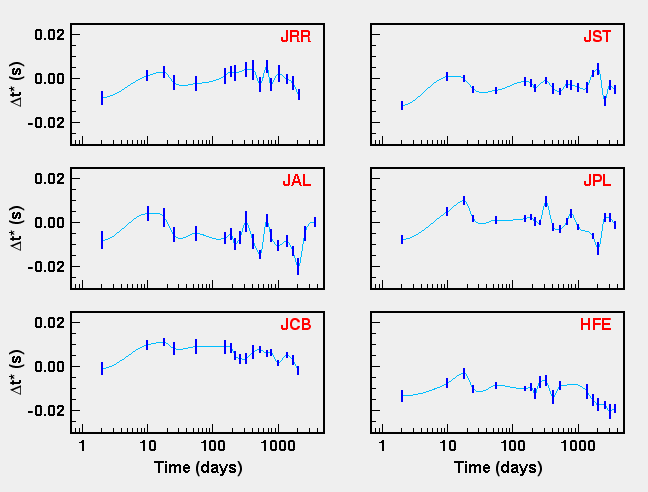
Figure 5b:
Dt* summary.
Temporal variations in t* along the propagation paths
from p1 to six NCSN stations.
Each vertical bar is ±1s,
derived from the least-squares fitting of a straight line
to the spectral ratio.
Days are measured from the date of the Loma Prieta earthquake.

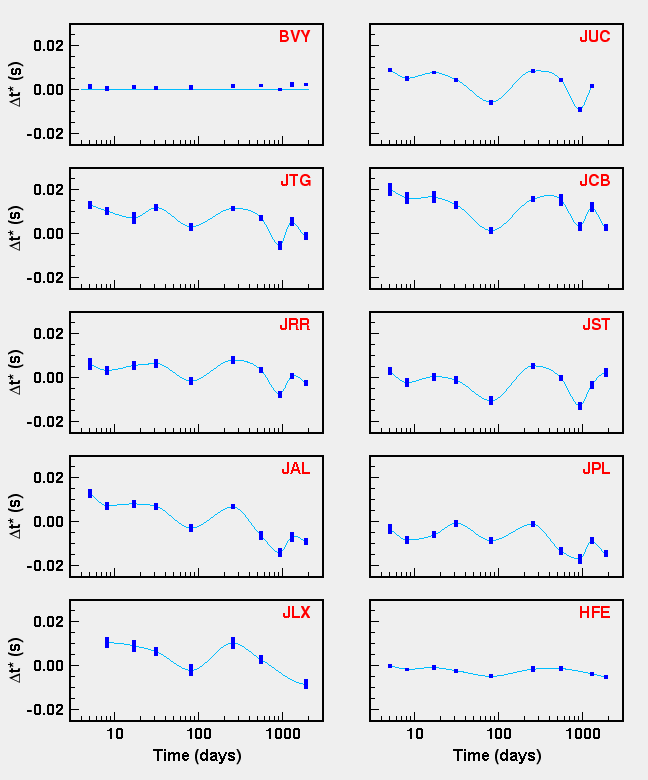
Figure 5c:
Dt* summary.
Temporal variations in t* along the propagation paths
from p3 to ten NCSN stations.
Each vertical bar is ±1s,
derived from the least-squares fitting of a straight line
to the spectral ratio.
Days are measured from the date of the Loma Prieta earthquake.

 gary.html /
Gary Henderson /
September 2005