A First-Hand Deep Seismic Probing
Using Data from GPS-Relocated Chinese Network Stations
The reliability and usefulness of 3-D tomographic models depend critically on both data quality and ray sampling density. It is known that for the widely used ISC data, the effects due to earthquake mislocation are comparable to the signals from a 3-D structure, or O(1s), in the case of teleseismic P arrivals. For the ISC data, the signal/noise ratio has been estimated to be less than 1.0 for regional P arrivals. Errors in station location, being systematic in nature, may contribute to spurious features in tomographic models.
Recent GPS analyses have revealed that the locations of some seismic stations long used to produce the Annual Bulletin of Chinese Earthquakes err by several km or more. They contribute to a systematic arrival-time error ranging up to 1.0 s or more for many regional P arrivals, and up to several seconds in the extreme case. In this study we use P arrival-time data from 800 GPS-relocated stations in NE China, plus 200 other stations in Japan and Siberia.
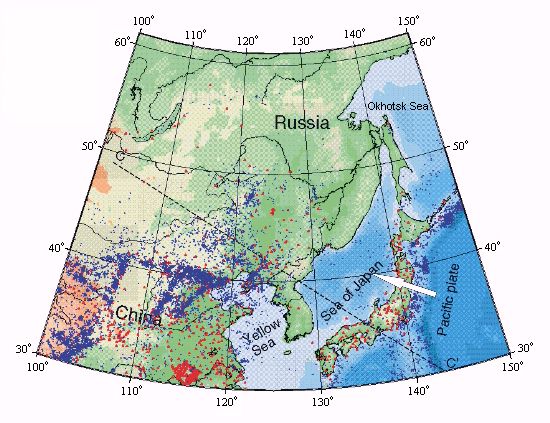
Figure 1: Map of Study Area.
(Red triangles are seismic stations.
Blue dots are earthquake epicentres.)
Our data amount to a total of 290,763 regional and 95,751 teleseismic
P arrival times (1978-99), all manually picked and re-examined
for reading errors and phase misidentification.
All told, 19,900 regional and 5,816 teleseismic events are included.
They provide by far the densest ray sampling coverage
of any previous studies in that part of the Earth.
An iterative solver, LSQR, is used to facilitate
the large-scale inversion and to help suppress artifacts
in regions of lesser ray coverage.
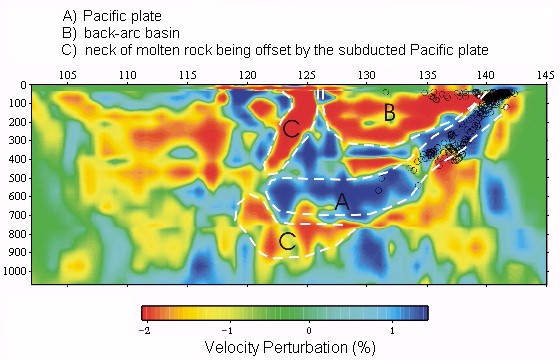
Our results show strong lateral variations in crustal velocity at shallow depths and generally low velocities in the lower crust in NE China. The Moho depth is uneven, as expected in this complex region of continental amalgamation of relatively recent vintage. To the east, a prominent low-velocity region lies immediately above a clearly delineated Pacific plate, seen descending to a maximum depth of just over 600 km northwest of the Japan Trench, where the deepest earthquakes terminate. The Pacific plate bends into a horizontal position beneath the Sea of Japan.
Figure 2: Velocity Tomography along Profile CC'.
(See dashed line in Figure 1.)
 jingsong.html /
Gary Henderson /
September 2005
jingsong.html /
Gary Henderson /
September 2005