

“A deep-learning estimate of the decadal trends in the Southern Ocean carbon storage” published in July 2022 in Nature Communications
Authors: Barbara Zemskova, Nicolas Grisouard, Tai-Long He, and Zirui Wan (top left to bottom right)
We spoke to post-doctoral fellow Barabara Zemskova about this work.
Can you tell us a little bit about the research you have been doing and its importance?
One of the major sinks for anthropogenic carbon dioxide is thought to be the ocean, in particular at the higher latitudes because the solubility of gases increases with decreasing temperature. It is estimated that the Southern Ocean, where persistent zonal (i.e., east-west) winds are strong and temperatures are relatively cold, is responsible for approximately 40% of the oceanic carbon sink of anthropogenic emissions. Understanding the changes in ocean carbon content is crucial not only for understanding the climate, but also marine chemistry. For example, an increased amount of dissolved carbon in the ocean has led to ocean acidification, which affects marine organisms. However, there are large uncertainties regarding the carbon storage potential of the ocean: studies have shown that after a period of decline during the 1990s, ocean carbon uptake may have increased in the 2000s. Because the shipboard measurements of carbon content in the ocean interior are sparse both spatially and temporally, estimating ocean carbon trends is difficult. Recent deployment of Argo floats (robotic instruments that drift around in the ocean interior) equipped with biogeochemical sensors has greatly enhanced the volume of available data; however, the timeseries of this data span a relatively short time period since 2014.
Our research attempts to resolve this issue of scarcity of carbon concentration data below the ocean surface through machine learning.
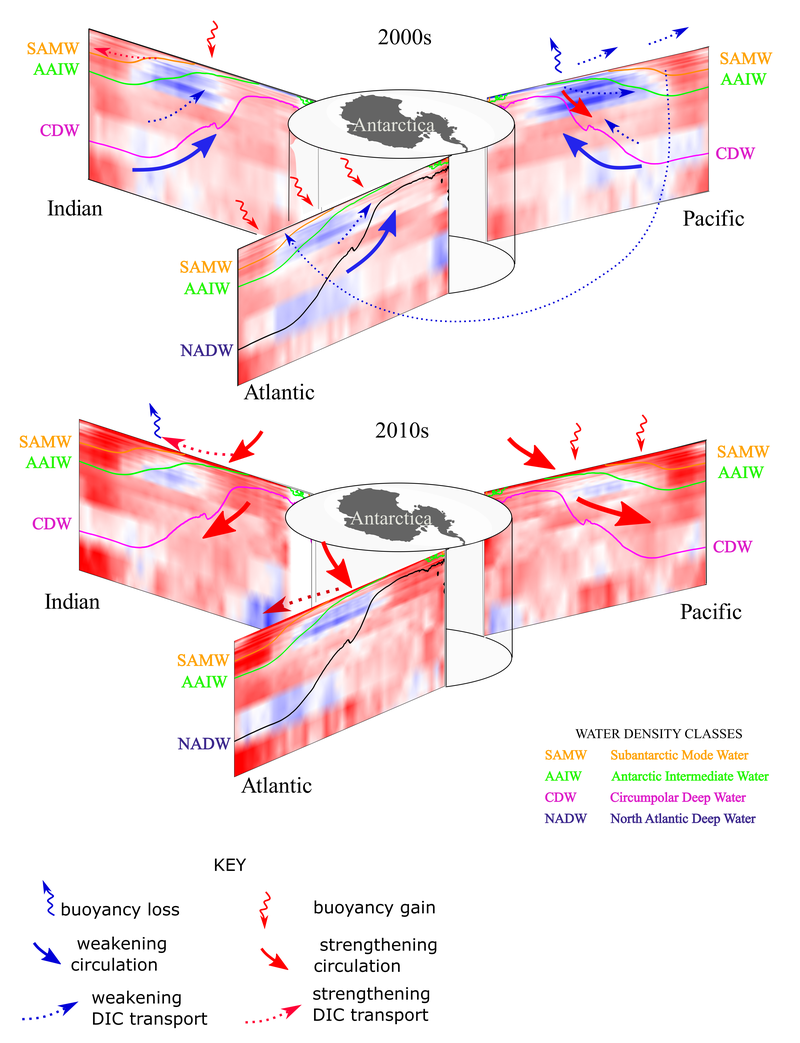
We developed a deep-learning neural net model that takes as input ocean surface measurements, which are readily available from satellite observations at regular and high-resolution spatial and temporal intervals. Our model then outputs estimates of dissolved inorganic carbon concentrations from the ocean surface to 4 km depth. We applied this method to calculate trends in ocean carbon concentrations over the past three decades and found that while ocean carbon content has decreased in the 1990s and 2000s, it has been decreasing at a faster rate since the 2010s. This means that the ocean’s potential to take up more atmospheric carbon has declined. Importantly, once trained, our model is fast and computationally inexpensive, which gives it an advantage over traditional ocean models. This makes our model a useful tool for monitoring future ocean carbon content from new satellite measurements as they become available.
What is your area of research and why did you choose to specialize in this field? How does it relate to the research article in the spotlight?
I am a physical oceanographer, and my area of specialization is understanding the physical mechanisms that drive mixing in the ocean interior, in particular what processes control the transport and distribution of heat and dissolved gases below the ocean surface. As my graduate education was interdisciplinary across different fields of marine sciences, one of my research goals is to connect the physical mechanisms that I study to biogeochemical processes, which fits well with the research article highlighted here. Most of my research has been driven by numerical modelling that is grounded by observational measurements. With the large volume of ocean data available from satellites, there is a big potential for the application of data science models to study the ocean, which is what we explore in the highlighted article.
What is the long term impact of this research?
Assessing the impact of atmospheric carbon uptake by the ocean requires both the estimates of past trends and continued monitoring efforts. Our model reconstructs the ocean carbon content for the past three decades, and computing new estimates requires only a small amount of computational resources and time. As such, it is a great tool to study the changes in the ocean carbon concentrations, which is important not only from a climatological point of view, but also for the management of marine ecosystems, which are sensitive to acidification.
What challenges do you face in this field of research and how do you overcome some of these challenges?
One of the major challenges in ocean modelling is that one must consider a wide range of temporal (seconds to decades) and spatial (millimeters to hundreds of kilometers) scales. Resolving across all of these scales takes a tremendous amount of computational power, time, and storage for model results, which is not yet possible with existing technologies and available resources. My research tackles this challenge by studying ocean processes in smaller-scale idealized set-ups in order to understand what mechanisms may not be fully captured in large-scale ocean circulation and climate models. Another challenge in oceanography is the sparseness of available direct measurements. Data science techniques, such as the deep-learning model used in the research article highlighted here, offer a promising solution to address this challenge in order to understand the spatial variability and temporal changes in the distribution and transport of tracers (e.g., heat, dissolved gases) in the ocean.
What else are you working on?
My current research has two primary directions. The first one involves further application of data science techniques (regressions and neural net models) to estimating carbon concentrations in the Labrador Sea.We seek to understand what physical and biogeochemical processes drive the spatial patterns and temporal changes in the carbon content. The second is focused on the generation mechanisms and propagation of internal waves, which are oscillatory movements below the ocean surface that exist because the ocean has variable density that changes, in particular, with depth. I focus on how these waves of different origin (either generated at the ocean surface due to wind blowing across it or by the flow encountering topographic obstacles along the ocean bottom) affect transport and mixing in the ocean interior.
Are there any other milestones that you hope to achieve and where are you in this process?
I am hoping to secure research funding in order to extend the model to other biogeochemical variables in the ocean. These estimates would enable us to separate the proportion of the increase in the ocean carbon concentrations that is due to the anthropogenic emissions compared with the portion due to the natural variability in the ocean circulation. Such a study would be able to assess the anthropogenic impact on ocean chemistry and evaluate the future carbon uptake potential of the ocean.
Read the full article here: https://www.nature.com/articles/s41467-022-31560-5